Pages

Wednesday, December 31, 2014

commodity, cyclicals, or pricing power

It's time for many to assess how they fared in the game of investing. I have selected some of the largest market-cap stocks from India, and some other randomly in order to check out their performance over the years.

The longer term
Since I usually do not look short term, let's start with the five-year period, where the markets returned 57%. Take TCS, India's largest company in terms of market-cap. It has returned 233% over the last five years, while Reliance lost money (negative 18%). However, it performed much better than NTPC which lost 40%; how pathetic, and how relative. So much for the previous government's promises of reforms, especially in the power sector. ONGC is up 16% in five years. Tata Steel is down 35% (blame it on bad acquisitions and more). And then there is Asian Paints, which returned 304%, and Nestle which is up 1019%.

A look at the picture below, and we get the picture, I reckon. 


I am not much interested in the year-on-year performance particularly, but some things do stand out, and tell us.

For the year 2014

For the year 2013

For the year 2012

For the year 2011

For the year 2010

The lessons
There are commodity businesses, and there are cyclical businesses, and then there are businesses which due to something about them that give them the pricing power. That is, they are able to increase prices of their products when they want to without worrying much about volume of sales. While the former categories rarely make investors rich, the latter category when purchased at the right market prices often rewards them sufficiently.

Obviously then it makes sense for us to watch those businesses which sell less discretionary products, have lower operating leverage, and not much of debt. These are the ones that have durable competitive advantages, and therefore, can sustain higher gross margins, and higher return on capital over a long period. Pick them at the right price (when markets have fallen off the cliff) in meaningful quantities, and wait for the price and value to converge. Have fun, get rich in the coming years ahead.

Monday, December 29, 2014

how instagram is worth more than $35 b

Instagram, an online photo-video sharing social media business was acquired by Facebook in April 2012 for $1 b in both cash and stock. Now it is being valued at $35 b. That is 35 times payoff in 2 years. 

Was the buy a bargain (sellers that foolish, and buyers that smart), or is this just another of analyst's fantasies?

With social media companies one cannot tell as the euphoria that was there during the late 1990s regarding information technology companies seems to be rubbing off regarding the social media companies now. Human behavior is the same at all times. Greed and Fear are the easy masks people like to wear.

I am not saying that Instagram is not worth $35 b; what I would like to ask is how do we know? It could be worth any value. There isn't any rational basis at the moment to justify with confidence that it is worth something.

We haven't got the revenues and margins; we don't know the growth rate; we haven't got the reinvestment that is required to sustain the level of growth that is expected.

We can definitely have a set of assumptions about these, and come up with a value. However, I can guarantee that the intrinsic value of Instagram as a business would be anything, but that value. The reason is simple: with technology businesses, it is almost impossible predict the future course. We might want to see a level of growth, but to achieve that growth, reinvestment of capital is required; information about market size and market share is required; we should know the sustainable margins which leads us to understand the market and predict competition.

One way to go around this is to have a distribution of assumptions and come up with probabilities, and then the expected value. Heck, it doesn't work that way. There could be probabilities, but then, in reality the actual value is not based on probability, but on a single set of fundamentals. Which of these assumptions will hold true, you never know. We can use probabilities only when there is a very high probability of an event occurring. Rest is pure academic.

Isn't then valuing a technology business a futile exercise? What is the point in valuing a business just for the sake of it? We should be able to make a buy or sell decision based on our valuation. If we are not able to do that, I find the exercise only academic. Not too bad for a class of students, though.

Hypothetically, if Instagram is worth $35 b, it is a better business than say, Hershey ($23 b), Sony ($22 b), ICICI bank ($33 b), Kellogg's ($23 b), State Street ($33 b), Southwest Airlines ($27 b), and Cognizant ($32 b). Is that so? I don't know. I am not saying that these market values reflect their actual worth. At least these firms have established revenue models.

Instagram does not have meaningful revenues at the moment. It might have a revenue model, but we are not privy to that information. I would argue that even the managers would be wrong in their estimates for a start-up business like this one.

Instagram's value could even be higher than $35 b. What I mean is that at this moment we cannot know this for sure.

With all this behind, I might as well give my estimates of Instagram.

If Facebook is worth $222 b and has 1.35 b users, we can use this information to price (not value) Instagram.

Here we go, Instagram is worth $49 b.


We can use price-to-sales ratio of Facebook to price Instagram to $53 b.


I can use a set of assumptions on revenues, operating margins, growth rate, reinvestment rate, return on capital, and use that to estimate the value of Instagram. But, I will keep that for another time.

I have had fun with these exercises in the past (TCS/Infosys, Facebook, Twitter, Twitter, Nokia, TCS, Blackberry, Google, FB/WhatsApp, TCS, Apple), but have never used that for any investing decisions. In fact, my concluding thoughts have been similar; we cannot value technology businesses accurately.

Yet, who stops us from having some fun? Let's play along...

Friday, December 19, 2014

oil buyer, or oil seller, that is the question

Back in 2012, I argued that value of an oil producing business depends upon two key factors: oil reserves and oil prices. While I wrote about the significance of being realistic about oil reserves, I did not much deal with oil prices as they are not within anybody's control.

Alas, we are left to deal with it in these times. With oil prices falling just like that, there are at least two groups who are affected. Those who produce oil, and those who consume oil. There is no prize for guessing in the current times who you would like to be. 


Naturally, oil producing businesses have been hit and oh boy. At less than $60 per barrel, suddenly the time is to be the buyer of oil rather than the seller. I wonder why then the stock buyers go gaga over rising stock markets rather than falling. That post is for another time though, let's come back to our current story line. 

Oil sellers
The right thing to do for the oil producers now is to cut back on production and let market prices of oil rise to the levels required to give them the required rate of return. Unfortunately, producers with lower financial flexibility (having high debt, and low debt capacity) should panic, and have higher chances of bankruptcy. These firms might not have time to wait for the prices to rise. A sorry situation reflecting probably poor managerial skills (financing decisions). Those who have the financial flexibility would be able to cut the production, and wait for the prices to correct. There is no time frame in this respect as the prices tend to be unpredictable, and to a large extent not controllable. 

Then there is another class of oil producers whose dynamics are decided by the state rather than the owners. Take the example of ONGC whose hands are tied regarding both production and pricing. Firms like this will have no option, but to rely on the state's (rather than the firm's) economic considerations. History suggests that the state has not taken the right decisions on behalf of the owners. Therefore, ONGC has not performed the way it would have if it were a private firm.

Oil buyers
The story is quite different for the oil buyers. Businesses who consume oil in large quantities as their raw material, and having pricing power on their finished products, are likely to be key beneficiaries of low oil prices. They should be able to increase their operating margins other things being equal. Businesses selling less discretionary products to the consumers are best placed to increase their value. 

Investors
Investors will be well placed to buy stocks of oil buyers having pricing power. And those interested in buying stocks of oil sellers should consider buying those who have low debt, large reserves, and control over the timing of production. Privately owned or publicly listed oil producers are better placed in this category rather than the state owned.

Needless to say that the price of the stock compared to its value should be the primary consideration before making any buy decision.

Saturday, November 22, 2014

kotak - ing vysya - and the winner is...

The merger of ING Vysya Bank with Kotak Mahindra Bank was announced on 20 November 2014. The next day the stock price of both the banks rallied suggesting that the market liked the deal.

On 21 Nov, ING Vysya closed at 7.83% higher than 19 Nov price:


 And Kotak closed at 11.59% higher:


It looks like the market liked Kotak better than ING Vysya. Is that fair? Do ING Vysya shareholders feel let down?

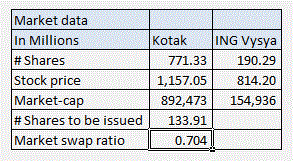
At the time of my analysis the market data was as follows:


Based on the market information Kotak would have had to issue 133.91 M shares to acquire ING Vysya, and swap ratio would have been 0.704 Kotak shares for each of ING Vysya shares. The actual swap ratio is 0.725:1; Not too far off. Again, is this a fair deal?

Kotak is retaining almost all of its income:


While earnings per share of both the banks have increased at a similar rate (about 14%) in the last four years, Kotak has not been that generous in terms of dividends payout, which implies that it is considering high growth potential for its business.

In order to check whether this deal is value accretive to the shareholders of both the banks we have to value each of them on a stand-alone basis first, and then on a combined basis.

With an expected annual growth rate (10-year) of about 15%+ for Kotak and about 11%+ for ING Vysya, we can value individual banks independently based on dividend-discount-model. Both banks are expected to have stable payout ratio, return on equity and growth rate after ten years.

Caution: Since I have used dividend-discount model for valuation, regulatory capital requirements are not separately considered. Probably, it makes sense to do another valuation based on capital adequacy required to achieve the target growth rate, although capital adequacy and Tier 1 capital ratio at present are at comfortable levels for both the banks.

Based on the valuation, both Kotak and ING Vysya appear to be highly over-priced by the market. That is, Kotak is using its expensive currency (high stock price) to buy another expensive currency. Since the actual swap ratio is close to the market-swap ratio, the first impression is that Kotak shareholders are benefiting more from this deal.

Even without considering any benefits from synergy, I reckon the swap ratio should have been about 0.879 Kotak shares for each of ING Vysya shares. Kotak should have issued 167.36 M shares assuming that market prices would correct to their rational (lower) levels in time to reflect the true fundamentals. Alas, market prices are higher, and as noted above, based on those prices Kotak should have issued 133.91 M shares. The actual swap ratio is much lower.

But then as talked about in every acquisition, there are synergy benefits.


If there are any synergy benefits from this merger, surely Kotak shareholders must have an upper hand over ING Vysya shareholders. The actual swap ratio of 0.725 Kotak shares to each of ING Vysya shares is much lower, and hence value-accretive to Kotak shareholders. 

Based on the terms of the deal, the implied numbers are as follows:


The implied value of this deal is Rs.159 B, and the implied price of the stock of ING Vysya bank is Rs.838.86 per share. There is hardly any premium on acquisition; sounds so unfamiliar, doesn't it?

Why is ING Groep, the largest shareholder in ING Vysya, letting this happen to itself? Is it because it is in need of cash? If so, what about the minority shareholders?

Monday, November 10, 2014

it's apple again - on sale, or wishy-washy

I did not plan to keep talking about Apple; but then, there is so much going on these days, I can't help it. I wrote about large cash Apple has been piling up; I also had my own advice on its use of cash. Heck, there is more advice too. Carl Icahn is not an ordinary guy of course, although he has been likened to a four-year old and to a six-year old. Icahn's history speaks of his capabilities as a successful investor what with billions in net worth. Not surprisingly, the subject matter is Apple again. 

I had argued in October 2012 that innovation was imperative for Apple to continue to be in the growth territory. At that time Apple stock was trading at about $600 per share (pre-split) giving its entire equity a market value of $570 b. Today it is $639 b. 

Optimism in 2012 
I had also supplied some contrasting opinions about where Apple might be headed. One of the arguments was that it would trade at $1650 per share (pre-split) by 2015; that is, its equity would be worth $1.5 trillion. Well, that argument was supported by robust revenues and margins that Apple would be able to sustain due to its ability to innovate and maintain its superior technology. The numbers looked like this:

iTV was estimated to be a $100 b business by 2015, and the argument went further: Apple would be a $610 b revenue company by 2015 as all its key markets start to experience hyper growth.

Whether these estimates will actually come to fruition is something that only time will tell. Nevertheless, $1500 b market value is huge, really unheard of.

By the way, Apple's revenues for 2014 reached $182.79 b. For it to clock $610 b revenues in 2015, they would have to grow by....well...you get the point.

$1 trillion as of October 2014
How about a little less optimistic, say, $1000 b market value? Carl Icahn is at it again; he is arguing that Apple stock which is trading currently at $109 per share, is actually worth $203 per share. He is supplying his estimates which look like this:


Icahn's estimates might appear to be much lower, but, in the context of Apple's recent performance they too seem to be far-stretched. While he is estimating large investments in research & development, he is also giving simplistic arguments that net earnings equal free cash flows available to equity shareholders. This assumes that depreciation equals capital spending and working capital requirements in future which may not be realistic.

Historical performance
Apple's revenues for 2014 reached $182.79 b, and the growth rate for the year was 6.95%.


Going by its history, it looks like the law of large numbers is showing up, and growth rate is coming down.

If we assume that Apple's revenues will increase by 6.95% (2014 growth rate) annually in the next 10 years, they would be $358 b by 2024. If they grow by 9.20% (2013 growth rate) annually they would be $440 b, but not until 2024.

For revenues to reach $610 b in 2024 (not 2015), they would have to grow by 12.81% annually in the next 10 years.

Icahn believes that Apple is dramatically undervalued; and accordingly, is pushing the CEO to use cash for large stock buybacks with the promise that he will not tender any of his 53 million shares (worth nearly $6 b). At least he wants to eat is own cooking; let's give him that credit.

I had a different idea, didn't I? Tim Cook won't listen to me though.

What is it
Is Apple really on sale, or all this is wishy-washy?

Saturday, October 4, 2014

Apple's cash farm

Seed, manure, reap and harvest, and presto! you have cash. Well, that's the essence of a farm. What if the farm is of cash itself? What if all we can see is cash everywhere in the farm? Sounds a bit exaggerated, let's follow the story, nevertheless.

The cash farm

Apple is due to file its annual results soon, and all I can see thus far is cash everywhere. In 2002 Apple had cash of $4.34 b; as of June 2014 it was $164.49 b.

What I ponder now is will Apple be able to continue harvesting this farm. I have no answer to this, but, from its low point in 1999 to its high point in the recent times, its story has been worth following.

Although it has spent $40 b in aggregate since 2002 on capex and acquisitions, it was also helped by positive changes in non-cash working capital and of course, depreciation. The result has been a very low reinvestment rate. The recipe is simple: high operating profits, low reinvestment, and hence, lots of cash. Its long term reinvestment rate has been less than 4%.

Because of its large cash, the operating capital employed in its core business is actually negative. Therefore, return on capital is not reasonable.

After massive success of iPhone, the company has not been able to find ways to deploy its cash. Clearly, investment alternatives are not visible now. After all, 164 b is enormous.

The ongoing buyback program requires $60 b more of stock repurchases by December 2015. It has also started paying out dividends. Yet, the cash pile is going up. Since a significant portion of its cash is tied up and trapped outside of the US, Apple has been tapping debt for buybacks and dividends. So, cash going out is also offset by cash coming in.

The market value of its equity currently stands at $596 b of which, $164 b is cash. iPhone, iPad, iTunes, and Mac comprise operating business. The stock is trading at $99.62 per share.

With certain assumptions on its business (revenues grow to $280 b in 2024, operating margin decreases to 25% and return on capital to 15% gradually by that time, reinvestment rate remains lower without major innovations), Apple stock does not appear to be in a bubble zone (does it?).

However, in the absence of any triggering event (such as new product or acquisition), its stock will likely trade at reasonable levels.

The options
Assuming that its operating business is kept alive until the Apple frenzy fades, i.e. no major innovations anticipated, I fancifully list some of the action points for the Apple managers:
  1. Investment policy: Very low reinvestment rate as no new good projects are envisaged;
  2. Financing policy: No changes in the capital structure; no significant debt increase;
  3. Consistent cash dividends in line with earnings;
  4. No significant stock buybacks;
  5. Use current and future cash for creating an investment operation. 
Investment operation
Apple should consider investing its current and future cash in an investment operation. Whole or a portion of some of the start-up, growing and mature companies can be bought at prices considered reasonable. These should become good projects for Apple eventually. Here's an illustrative list:


With just $65.50 b Apple can have ownership in different technology businesses. It can also consider investing in non-technology (growing) businesses, and also in mature businesses to fortify its investment portfolio. 

There is no shame in admitting that it has lost out on core business investment opportunities. That fact is actually conveyed without telling.

Wednesday, September 10, 2014

alibaba goes public

I have noted my thoughts on Alibaba earlier in August. The market is keen to value the company's equity in the range of $200 b; and I argued that to get to that number the company has to achieve revenues of $87 b in 2024. 

I also argued that to get the right perspective we should translate those revenues into Alibaba's GMV (market value of Gross Merchandise Volume) and then into China GMV, and check whether the overall market (China GMV) appears to be achievable.

Subsequently, the company filed its revised prospectus. Based on the revised numbers I attempted to see what it will have to do to get that $200 b.

The key change has been much higher reinvestment rate required to achieve the growth rate. This is what I got:

Can Alibaba achieve those revenues and maintain higher margins during the growth period? By 2024, the China market has to see $5,697 b and Alibaba has to see revenues of $91 b. I have assumed that the market share of Alibaba would reduce gradually from dominant 84% to yet significant 50%. It cannot keep those large operating margins for too long; and it is the same for return on capital. After 2024, the expectation is that Alibaba would become a mature business behaving like one with all the caps in place.

And how can we ignore that tangled web of corporate legal structure?

Saturday, September 6, 2014

cash is not showing up at ndtv

The market price changes
When this company came out with a public offering in May 2004 at Rs.70 per share, the market value of its equity became Rs.4.25 b. Later in March 2005, it went up to Rs.12.5 b. Sometime in June 2008 the company's equity was selling at Rs.30.2 b.

Alas, today it is selling at Rs.5.49 b (Rs.85.15 per share), which is actually a remarkable recovery from a low of Rs.1.6 b in December 2011 (Rs.24.75 per share). So we might say a very smart investor (or should we say a speculator?) who bought in 2011 would have made a lot of money. Never mind the story of this company which is equally remarkable. 

The story
The story of this business is rather simple. From the time its stock became publicly traded, it has never made any money. Revenues increased by more than 20% annually from 2004 to 2014, but operating profits, never (ok, except 2005) did. So far over last 11 years, the company incurred cumulative operating losses of Rs.13.8 b on cumulative revenues of Rs.40.5 b. Its operating margins are negative; its net margins are negative. Its return on capital is negative; its return on equity is negative. It has never earned any free cash flows. It has not paid out any dividends for the last 6 years. Yet, it is selling at Rs.5.49 b; isn't that remarkable?

The qualification
The company has also received negative remarks from its statutory auditors regarding management remuneration.


Long term shareholders
The story has turned out to be not that great for long term shareholders.


They would have been better off investing in the index itself.


The majority shareholders
While the promoter shareholding continues to be high (61.45%), the institutional shareholding is 6%. BNP Paribas and Tarra Fund hold about 5.78%. Other major shareholders do not seem to be interested in trading. That leaves shareholders owning about 10% of the company's stock who would be setting the prices. And they have set the prices as the story got unfolded.

The future
Either the business is pretty bad (which I don't think), or it has been rather badly managed. Value unlocking can take place in such a case when the business is run more efficiently. If the (controlling) stake sale is made to a better manager the operating margins and return on capital might improve, hopefully. If they do, the value of the company should increase.

If there is status quo, the story gets worse.

Saturday, August 30, 2014

google's decade

The decade ago
On 18 August 2004 a not-so obscure company came out with its first time public offer of 22.53 m Class A shares at a price of $85 per share. Of this 14.14 m shares were sold by the company and the remaining 8.39 shares were sold by the selling shareholders, making the offer one of the biggest in history in dollar terms. The company collected $1.2 b in cash. The rest as they say is history. 

Google Inc. was incorporated in 1998. As the company itself puts it, Google is a global technology leader focused on improving the ways people connect with information. The mission is to organize the world’s information and make it universally accessible and useful. 

The decade after

Well, it looks like so far it has lived up to all that is said. Market value of its equity stands over $385 b today.

Google basically derives most of its revenues from online advertising. Other revenues consist of non-advertising revenues including licensing, hardware and digital content. 

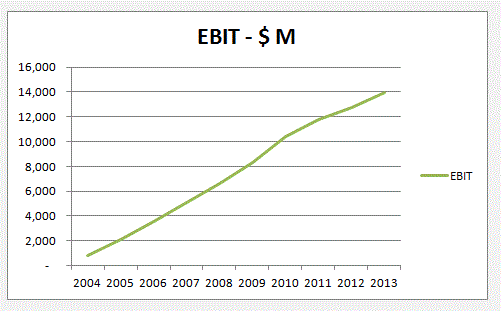
Google's revenue has increased from $3.2 b (2004) to $59.8 b (2013) and operating income from $840 m to $13.9 b.


Revenue composition in 2013 was as follows:


For Google, operating margin on advertising revenues are higher than on other revenues.


Return on capital has come down to a more reasonable 42.86% in 2013.


Pretax operating margin is steady at 23.34% (2013).


Google's share in international market has only increased. Now its revenues outside of the US is 54%.


Pretax income from domestic operations was $5.8 b and from foreign operations was $8.7 b in 2013.


Revenues
Most of its customers pay Google on a cost-per-click basis (Google AdWords), i.e. the customer (advertiser) pays only when a user clicks on one of its ads. 

There are also cost-per-impression revenues where advertisers pay Google based on the number of times their ads display on its websites and Google Network Members’ websites. 

Google distributes its advertisers’ AdWords ads for display on Google Network Members’ websites through its online program, Google AdSense. These revenues are recognized on a gross basis because Google considers that it is the primary obligor to its advertisers.

Revenues are poised to grow in future as online commerce takes off.

Operating margins and return on capital
We can expect its operating margins and return on capital to come down slowly in the next decade before they reach to more sustainable figures. How about 20% margin and 15% return on capital?

The cash.......trapped
Google has been hoarding cash big time. As of December 2013 it had cash of $58.7 b.


It can do a lot of things with that cash. It can buy Twitter for $30 b and LinkedIn for $27 b, or it can buy Tesla for $33 b. It is not likely, though.

As of that date, $33.6 b of cash was held by its foreign subsidiaries and was considered trapped, as this cash cannot be used for paying dividends, doing stock buy-backs or investments in US. Unless of course the differential tax (between tax rate where it was earned and the US tax rate) is paid on that cash before bringing it to the US. This is thanks to the US tax code.

Nevertheless, Google does not consider the cash as trapped because it wants to permanently reinvest outside of the US and its current plans do not demonstrate a need to repatriate them to fund its US operations.

This is a clever way of saying unless you change the tax code we will keep cash outside. Too many US firms are behaving in a similar manner of late as too many of them keep generating more cash outside of the US. The debate over being patriotic or just rational is getting hotter today.

Acquisitions and goodwill
Google has done a number of acquisitions over the decade; a cumulative $20 b of cash has been spent.

Click Holding Corp. (DoubleClick), a company that offers online ad serving and management services to advertisers, ad agencies and web site publishers, was acquired in March 2008 for $3.2 b of which $2.3 b was attributed to goodwill.


Motorola was acquired in 2012 for $9.6 b (net of cash taken over) which resulted in $2.5 b of goodwill. Motorola Home was sold in April 2013 for $2.5 b to Arris Group Inc. including a 7.8% ownership in Arris, and Motorola Mobility was sold in January 2014 for $2.9 b to Lenovo including some shares in Lenovo.


It is clear that Motorola was not the right candidate for synergy benefits.

The carrying value of goodwill is expected to generate cash flows of at least $11.5 b in terms of present value. Otherwise, it will be considered impaired, i.e. Google overpaid for its acquisitions.

Voting powers and control - Is it a fair deal, who cares?
Google has more than one class of shares. Class A shares with voting rights and traded, Class B shares with significant voting rights and not traded, and Class C shares without any voting rights (except as required by applicable law) and traded.

As of December 2013, approximately 92.2% of Class B shares beneficially belonged to Larry PageSergey Brin, and Eric Schmidt, which translates into approximately 61.7% of the voting power. 


In April 2014, stock dividends in the form of Class C shares were distributed (1:1 ratio) to the holders of Class A and Class B common stock. 

As of June 2014, there were 675.91 m common shares were outstanding.


It is very clear who controls Google, and if there are any further doubts, it is cleared in the form of the power of the board to issue, without stockholder approval, preferred stock with voting or other rights or preferences that could block any attempts of hostile acquisition. 

There is no chance that any outside shareholder would be able to influence corporate decisions at Google. None.


The next decade
Google is in a good position to take its best steps forward. As online business expands and emerging markets open up, there are immense opportunities to grow both in terms of size and value. Google has been reinvesting earnings back in its business with average reinvestment rate of 50.75%. It has also been spending sizable amounts on research and development each year.

How much it will grow in value in the next decade will depend upon how much revenues it will generate, how much it will earn in terms of operating margin and return on capital, how much reinvestment it will make, and the odds of making it.

Who wins this online warfare ultimately is any body's guess. However, as long as Google does not do anything stupid with its large cash the odds appear to be in its favor.

Will it live up to its current story line? Again as Google itself puts it, its business is characterized by rapid change and converging, as well as new and disruptive, technologies.

Tuesday, August 26, 2014

alibaba, the giant virtual mall

Gigantic initial offering
Shopping is becoming more technology-driven and purchases easier than before. As e-commerce expands over the globe and gives a platform for buy-and-sell the traveling costs should become lower. Delivery of goods and transfer cash where needed is only a matter of a click. When billions of people are becoming shopping-spree why not some of them become supply-spree? The sum of all activities engaged in business that is taking place online is poised to be gigantic. 

Alibaba group is one such big supplier who wants to get bigger. In May 2014, it filed its registration documents to go public in the US. With an estimated $20 b of capital raising it is touted to be one of the biggest IPOs in American history. 


Will investors buy into the Alibaba story? To check that let's have some background about the business

The tangled web of Alibaba 
Alibaba group is a huge shopping complex, a fairly large internet search engine (competing with Google), and a not-so-small bank all bundled together. 


The timeline:


  • Taobao Marketplace - online shopping;
  • Tmall - third-party platform for brands and retailers;
  • Juhuasuan -  group buying marketplace;
  • Alibaba.com - online wholesale marketplace;
  • AliExpress - global consumer marketplace;
  • Alipay - payment and escrow services for buyers and services;
  • Cloud computing services.

Alibaba and online China:


The players and the platform:


Logistics:


The story behind the pitch
Gross market value of merchandise sold on Alibaba's websites (GMV) is reported to be $248 b which is much higher than Amazon ($100 b) and eBay ($76 b) combined.


Of this, $37 b GMV came from mobile users.


That makes Alibaba the largest online and mobile commerce company in the world in terms of GMV. And the pitching does not stop.


The billionaires in the making
After the listing the current shareholders are likely to become wealthier by far.


It must have cost $280 m for Softbank to claim 34% ownership in Alibaba. For Yahoo it cost nothing to retain its shareholding because it collected much more from part sale of its stake than what it paid for the entire stake.

The tangled web of legal structure and contractual agreements
Because China has restrictions on direct foreign ownership the way is worked around such that laws are not compromised. These agreements in effect transfer most economic risks and rewards related to the business to the investors.


Composition of revenues
Alibaba primarily gets revenues from online advertisement and commissions; it also earns from fees, value-added services and cloud computing services.

A significant portion of revenues comes from online China.


Value of Alibaba
If Alibaba has to achieve what it aims to achieve success of this IPO is crucial. That means investors will have to buy into the story said so far.

Value of Alibaba is dependent upon its ability to monetize large online market and online consumer base of China in particular, and global in general. In effect it has the task on hand to convert market into market share, market share into revenues, revenues into operating profits, and finally operating profits into free cash flows. Can Alibaba pull it off?

The market for e-commerce has been enormous, and showing enormous potential for growth. If the following has to be believed, Alibaba had 83.76% (RMB 1,542 b) market share of the total China e-commerce of RMB 1,841 b in 2013.


Can online market grow as estimated? Specifically, can Alibaba continue to maintain its already dominant market share? Chances are lower on the latter, accordingly, we can expect the share to steadily come down in the years to come.

Operating margins
Alibaba's operating margins have improved from 25-30% range to the present margin of 48.1%. It is also unlikely that such a large operating margin can be sustained for long.

We can expect a few things going forward:
  1. China online market will continue to grow.
  2. Alibaba market share (GMV) will continue to slide from 84% to a lower, yet probably significant, share.
  3. Its gross margin (revenues as percent of GMV) is 2.6% at present; we cannot expect it to improve significantly.
  4. It will be difficult to sustain high operating margins for long; they will slide.
  5. No dividends will be in sight; Alibaba will have to spend lots in reinvestment each year.
  6. After a decade or so, it is more practicable to assume that both the total market and Alibaba will grow at a modest rate. In fact Alibaba should show signs of a mature firm. It could generate sustainable cash flows, pay dividends and do buy-backs, and have capacity to borrow more.
$200 b tech giant
Alibaba is soon likely to become one of the tech giants in the world.


However, there may be some gaps in this process of wealth creation.

I tried but concluded that to get to the value of $200 b Alibaba will have to do a lot of things - generate huge revenues and maintain margins.

The main issue is that we cannot attach high market share and high operating margins to Alibaba for too long. They will have to fall to a much reasonable and comfortable levels. And when we do that the result is a high implied growth rate to get to $200 b value of its common equity.

To know why consider this: Even when I let Alibaba enjoy reasonable excess returns until perpetuity (which I usually deter) during the stable growth period, I get year 10 revenues of $87 b. To get the right perspective we should translate those revenues into Alibaba's GMV and then into China GMV, and check whether the overall market (China GMV) appears to be achievable.

Two things to remember: There are caps on stable growth (perpetuity) period numbers; a firm cannot go on doing great things forever. Even during those great things period where growth is high it does not come free; the firm has to reinvest proportionately to achieve that growth. That reinvestment keeps a check on free cash flows.

Finally, it will be good to ask a few questions: how sustainable is this China story? Will there be any hiccups? For how long Tencent, Baidu, Amazon, eBay and others will let Alibaba keep those extraordinary returns? Are there any what if questions?

It has been thus so far: Jack Ma envisages and Joseph Tsai executes. Can these two make it to the next level?