Pages

Showing posts with label firms. Show all posts

Monday, May 13, 2019

microsoft and a trillion

Microsoft Corporation share closed the day at $127.13 with a total market capitalization just shy of a trillion dollars. The entire equity of the firm was worth $245 b some time in 2008. The growth has been both phenomenal and unprecedented because of the products it was dealing with and sheer size.

Revenues in 2008 were $60 b, and comprised the following.


In 2018 as revenues nearly doubled, the segments have changed.


The intelligent cloud has been the savior for Microsoft which experimented with many things using cash flows from Office and Windows. The elusive growth has been restored at least for sometime. Operating profits and (pretax) free cash flows to firm were $35 b in 2018. The growth in pretax fcff was 8.5% and 12.4% during the last 5 and 10 years respectively. Pretty decent given Microsoft's size of operations.

There were at least 2 major acquisitions in the past decade. Skype was bought at $8.6 in October 2011, and LinkedIn for $27 b in December 2016. Taxes in 2018 were exceptional; Microsoft is capable of $25 b aftertax fcff each year. Is 40x fcff a fair price for Microsoft? I am not sure. Apple is making nearly twice free cash flows, and yet is priced similar to Microsoft. But then Apple is banking on just one product, iPhone. Microsoft has a better product mix; Office and Windows generate steady free cash flows.

Even with a 10% growth for the next 5 years, and then moving towards a steady growth state in year 10, Microsoft may not give 10% return. If you are going to be ok with that, you might as well be ok with the S&P-500 with a far lower risk.

Microsoft has done well, and it is likely to do well in terms of its business and operations. But the stock is also not coming cheap.

Let's see again the numbers coming up for the year ending June 2019.

Monday, April 29, 2019

axis and yes bank q4

Both Axis bank and Yes bank reported their financial year results, and here's the story. Axis reported Rs.50 b profits for the year, and Yes had Rs.17 b profits. 

Yes also had losses of Rs.15 b for the latest quarter weighing in heavy provisions. While people are fretting over those losses, they don't get that when an investment turns sour, it just can't be called sweet; taste it to know it. Postponing provisioning for non-performing assets doesn't make sense even when the regulator or laws allow it; that will be stupid. On that front, Yes bank has probably done the right thing. 

Yes bank's book value is Rs.116 per share, while that of Axis is Rs.263 per share. With these numbers, their stocks are trading 2x and 2.8x respectively. But that is not the way to look at it. They have more NPAs, including stressed assets, that are not yet provided for. Including them in book value will inflate equity. Adjusting for full provisions on estimated NPAs, the stocks are trading 2.68x (Yes) and 3.43x (Axis).

Both banks have decent regulatory capital ratios: Axis (12.7%) and Yes (11.3%) in Tier 1 capital. Loan book is growing for both banks. Axis has better CASA (44%) compared to Yes (33%). Axis also has lower cost of funds (5.69) and Yes (6.5%), and slightly better net interest margins (3.44%) compared to Yes (3.2%).

Yet considering the current stock price, for a return of 13-15% in the next 3 years, Axis will have to grow 20% and Yes, 15%. Of course there will be people who will shoot for Axis in terms of higher growth and better book. At its current price though, Yes bank could give a return of 8% with a 10% growth rate. This is based on the reported gross NPAs and stressed assets; any hidden NPAs should bring the book equity and returns lower.

There is also a good chance that the Yes bank stock will be hit hard in the next trading sessions, and that should give opportunities for better returns. Axis bank is also likely to do well, but its stock price as of now is a little on the higher side. 

Friday, April 26, 2019

tesla q1 2019

Tesla reported its q1 numbers, and are we in for a surprise, or we aren't? That question depends upon whether we are a Tesla bull or bear. Vehicle deliveries fell short, and apparently had to be shifted to q2. The company still stands by its guidance of 360-400 k vehicles in 2019 representing a 50% plus increase over 2018. With Gigafactory China coming up, the target is 500 k vehicle deliveries. 


There was a significant reduction in revenues compared to the previous quarter. Tesla had operating losses of $521 m, and interest charges were $157 m. Cash loss from operating activities were $639 m, and over $300 m capital expenditures meant negative free cash flows of nearly a billion dollars. Tesla also repaid over $500 m of debt. Because of these, closing cash position was $2.6 b compared to the opening position of $4.2 b. The company has a debt of $12 b, and in addition, also had operating leases which are in effect a form of debt. 

The management has a guidance of capital expenditure of $2-2.5 b in 2019. So we should expect the company to make cash flows of at least that amount just to breakeven.

To justify the market value of nearly $50 b - never mind the fall post results - Tesla should do a lot more than what it has in the past. 

Friday, March 22, 2019

coffee day

Coffee Day Enterprises operates in 6 segments: Coffee and related; Logistics; Financial services; Leasing of commercial office space; Hospitality services; and Investment operations. It operates Cafe Coffee Day chain across India. 

The total business had revenues of Rs.37 b in 2018, an increase of 21% over 2017. Revenues have been growing in double digits for the last 3 years, 2018 being the best year of growth. The financial services revenues were Rs.5.7 b and that of leasing were Rs.1.4 b. Investment operations were Rs.530 m. 

The company had book debt of Rs.50 b and operating lease debt of Rs.1.8 b in March 2018. Because it also operates in financial services business, I am not going to look at its operating profits. That will not be meaningful because for financial services, debt is like a raw material, and interest costs are part of its operations as opposed to other businesses.

Earnings for 2018 were Rs.1 b. But after adjustment for the exceptional item (sale of stake in Global Edge Software) of Rs.532 m, it is actually an increase of 13% over 2017. Earnings per share were Rs.2.51 excluding the exceptional item compared to Rs.2.28 of 2017. Return on equity is less than 5%. There aren't free cash flows generated by the business. 

But the stock is trading at Rs.291.75 implying over 100 times 2018 earnings. Who are its buyers? 

The company owned 28,056,012 shares in Mindtree representing 17.08% ownership as of December 2018.

Coffee Day Trading is a subsidiary of Coffee Day Enterprises. In March 2019, the news is that the company and its promoter have signed a definitive agreement to sell their entire stake (20.41%) to L&T for a consideration of Rs.32.69 b. The price per share works out to Rs.975; and the stock is currently trading at Rs.950. 

As per this report, the total investment in Mindtree was Rs.3.4 b: Rs.440 m in 1999 for 6.60% stake; Rs.850 m (5.57%) and Rs.400 m (2.05%) in 2011; Rs.1.71 b in 2012 (6.84%). 

If the transaction does go through, the company will have a cash flow of Rs.27 b, handy enough to reduce debt. And the promoter will reap over Rs.5 b.

Coffee Day came out with an IPO in October 2015 at Rs.328 per share, and the stock commenced listing in November 2015.


The stock is yet to recover from its IPO price. But the question is: Is the business worth Rs.62 b? 

Monday, March 18, 2019

lyft ipo

Lyft is coming up with an IPO at an expected valuation of $20 b to $25 b. Its previous private valuation was $15 b in June 2018. Now that it is coming out with a $2 b IPO, the market is going frenzy.

Here are the investors seeking a valuation as high as possible. 


And why not, when there are buyers at the price? But then pricing is a game played by the private equity and venture capitalists, and for the right reasons: They want to cash out. That's their compensation for taking risk.

What about investors who like looking at the business and numbers? I haven't got a story for Lyft, for it is beyond my imagination how far it can or cannot go. It could do very well, or it could falter. I am not sure. That's not my game. But I can lay down the numbers. 

Lyft had revenues of $343 m in 2016. They became $1 b in 2017, and $2.1 b in 2018. That's a massive increase. But the business incurred losses in operations: $693 m, $708 m, and $978 m. Markets say it is the nature of the business like any other high growth start-up. 

The business is not using much of capital. It had $3 b in cash, marketable securities, and restricted cash as of December 2018. But it will need a lot of capital going forward. Because it is losing cash every year: It has been losing over $500 m each year (2016 to 2018). For 2018, this is despite $625 m positive cash flows from changes in non-cash working capital.

We haven't got a firm hold of numbers since operating profits and earnings per share are both negative. It has had low capital spending: $71 m for 2018, and much lower during the previous two years. It acquired Bikeshare Holdings (Motivate) for $250 m, and spent $300 m on research and $352 m on advertising in 2018. That's a significant portion of revenues. There are no free cash flows yet. 

Where do we go? Easy, look at the pricing multiples. 

If we price Lyft based upon revenues: For $20 b valuation, it will be 10 times revenues. That will come down to 8x if revenues increase by 25% next year, or 6.67x if they increase by 50%, and so forth. Pricing always gets interesting.


If we choose riders: The price per rider will be $667 for the $20 b Lyft. The catch is Lyft had 18.6 m active riders. The the price per active rider will be $1,075.


How about pricing based upon bookings? 


Lyft at $20 b = 2.5 times its 2018 bookings. Cool.

There were 241.614 m shares outstanding after conversion of preferred shares as of December 2018. If we round off and consider 250 m shares, the expected IPO price will be $80 per share to get that $20 b value.

Then you can juggle, and include the options (6.828 m) and RSU (31.605 m) outstanding, and come up with 280 m shares; and the price per share will be about $70. If you include $2 b coming from IPO, the price will be $64 per share, with an additional 31 m shares being issued and totaling 311 m shares.

Lyft is a good business. But the question is at what price. That's the conundrum we face with every technology growth business, don't we?

Monday, March 11, 2019

coke and pepsi

Coke or Pepsi, which is better? Both are lousy as consumer products. But I mean, which is better as a stock? Coke is worth $191 b, and Pepsi, $161 b. The Coke stock implies nearly 30 times its earnings, the Pepsi stock, 13 times. Why should Coke trade at a higher multiple than Pepsi? Is Coke growing better than Pepsi? Which business has a better return on capital and return on equity? Or is there a bias?

Coke has a better operating margin (20%) compared to Pepsi (16%). But I don't care much about operating margin. What I do care is return on capital. Pretax return on capital for Coke is 25%, and that of Pepsi is 30%. These are long term averages. The most recent values are 36% for both Coke and Pepsi. 

And I care as much about sustainable growth rate. The 5-year average growth rate in revenues for Coke is negative 7.43%, and the 10-year average is 0%. It had revenues of $31 b in 2008, and they were $31 b in 2018. For Pepsi, the 5-year average growth rate in revenues is 0%, and the 10-year average is 4%. It had revenues of $66 b in 2013, and they were $64 b in 2018. Pepsi's revenues grew 1.79% in 2018, and Coke's fell 10%. So much for growth rates. 

They have products that are not healthful, and there is no growth in revenues. Do we really want to talk further? Both companies spend considerable amount on advertising. But it seems that Coke is more desperate, for its average ad spending is 10% of its revenues compared to Pepsi's 4%. Yeah, Pepsi has more diversified products. 

When we capitalize advertising costs, the pretax return on capital changes to 27% for Coke and 31% for Pepsi for 2018. I am using pretax return on capital because of strange things that have happened in tax rates recently. 

Both companies are mature businesses and payout significant dividends. The 5-year average growth rate for Coke dividends is 6% and 8% for Pepsi. The 10-year average is 7% for both. 

Let's look at free cash flows. Pepsi had $6.75 b pretax cash flows for 2018, and Coke had $6.1 b. The 5-year average for Pepsi is $9 b and $6.79 b for Coke. For both companies, free cash flows have not been growing. In fact, they are falling. 

So again, why should Coke be priced higher than Pepsi? Is it because a prominent investor holds it and backs it? That's appears to be a stupid idea. But then we are not dealing with rational people.

I will start with $6 b as aftertax free cash flows for Coke and $6.5 b for Pepsi. Never mind these are much higher for Coke compared to its historical numbers. With these assumptions and a growth rate of 5% leading to a cap on the growth rate after a decade, we get similar values ($85 b) for both at an expected rate of 10%. 

Based upon free cash flows at least, the market pricing for both companies appears to be on the higher side. But my point is that Coke should not be priced higher but lower than Pepsi. And this has not happened for a long time. In fact, most of the time, the yearly low market value of Coke has been higher than the yearly high market value of Pepsi. That is bias, Coke being accepted as a more prestigious brand. But then who cares for the brand when the cash flows behind it do not justify the price? 

I am no fan of either, for I don't like their products. But it is time that the market realizes the potential of these companies, and prices them accordingly. 

Thursday, March 7, 2019

amazon march 2019

I have written about Amazon before, and as I have admired the company as a disruptive business, I have never been impressed with its lofty valuations. Value of a business, after all, is the sum of its cash flows discounted at an appropriate rate. It is not anything else. Markets may have been overwhelmed by Amazon, but at the end of it, its value is driven by its cash flows. 

In 2008, Amazon had free cash flows of $773 m. In 2012, they were negative $640 m due to higher capex. In 2015 and 2016, Amazon's free cash flows were over $4.5 b. Just when we thought the business will generate consistent cash flows, we had a surprise. In 2017, because of $13 b Whole Foods acquisition, cash flows were negative $11 b. For 2018, it had $9.8 b of free cash flows. They have been quite erratic as they usually are for a growing business. We have a conundrum: What are the sustainable free cash flows for Amazon? Last 3-year average is $1.1 b; 5-year average is $1.5 b. If we ignore 2017 as an exception, the 3-year average is $6.5 b. Heck, we at least need a starting point. 

I am not much of a story person. I need the business to tell me the story rather than me weaving one. The total market value of Amazon's equity is $820 b. Let's assume that investor's expected rate of return is 10%. I don't want that cost of equity shit. If I want 7% return, I will go to the S&P-500. With that out of the way, we need two more variables. One is the free cash flows, and the other is its growth rate. 

I will be an Amazon bull - which I am not - just for fun. Let's start with the beginning free cash flows of $9.8 b. Let's keep the growth rate high at 25% over each of the next 5 years, which means they will be about $30 b in year 5. I have estimated free cash flows aggregating to be $325 b over the next 10 years. For the record, they totaled $12 b in the last decade. Keeping the stable growth rate at 2.5% after year 10, I have put a break on optimism. Amazon had cash equivalents of $41 b and book debt of $32 b as of December 2018. But, it also had lease debt of $23 b which are off balance sheet because of some funny accounting rules. When I use these numbers as valuation input, I get a value of Amazon's equity much lower than its current market price. That's something to note because I have used high free cash flows as a starting point along with high growth rates.

May be one thing I missed was using high perpetual growth rate. Here's is the thing: If we used 6.5% as growth rate in free cash flows as perpetual, we get to its current market value of $820 b. The present value of Amazon's free cash flows at this growth rate is only 20% of its total value. The bulk of its value is coming from the stable growth (perpetual) period. If we start with lower cash flows as base, we will have lower value. Obviously if we keep the growth rates lower, we have lower value. 

I am amazed that Amazon continues to be priced by the market at such lofty expectations. You cannot buy an asset for its future price. The time value of money will tell you that. And yet...

Of course, when we do adjustments for lease debt, advertising costs, and technology costs, Amazon's operating margins, return on capital, and return on equity look good. But you need cash flows to value its business, and they aren't good enough at its current market price.

In March 2013, I thought long term thinking was doing good for Amazon (market value $120 b). But in February 2014, I asked, how long is long term ($160 b). In May 2015, the question was, when's the money ($200 b). In September 2015, I noted the price and value mismatch ($235 b). In July 2016, I compared Amazon with Berkshire Hathaway, and continued to ask, where's the cash ($347 b). In March 2017, I noted that when Amazon's market value hits $600 b Bezos will be the first $100 b person ($427 b). By August 2017, I talked about the hype ($474 b). In October 2017, I looked at Amazon's q3 numbers ($525 b). In February 2018, Amazon was worth $695 b, and Bezos $100 b. In August 2018, Amazon was worth $908 b as I compared it with Apple. 

Every time I try to value Amazon, I am far from meeting its market price, and I have been wrong in expecting its price to fall. Now Amazon is worth $820 b, and I say the same thing: that Amazon is expensive compared to its cash flows.

Amazon had revenues of $232 b for 2018, an increase of 30% over 2017. North America accounts for 60% of it, and Amazon Web Services, 11%. There was a marked improvement in operating profits for the North American (retail) segment though.


Nevertheless, AWS accounts for much of the operating profits, and the international segment continues to suffer operating losses. AWS has been very profitable and is growing faster than retail. As such, it would be better to look at AWS as a separate business, and value it independently.

There were 2 acquisitions in 2018: Ring for $839 m and PillPack for $753 m. Technology and content costs were $28 b. Amazon is still a growth company, and for that it needs a lot of capital. The key is how much free cash flows it will be able to generate in the next decade. It is a disruptive business, it is a fantastic business. But then it is also richly priced; and it has always been like that.

Friday, February 22, 2019

the tata group

The executive chairman of Tata Sons said recently, "we have moved away from fixing to focus on growth".  I have not dug deep into the context behind the statement. What I know is that just physical growth will not contribute to value. That has to be accompanied with consistent excess returns. Value creation to shareholders is the primary focus for managers of any business. Their duty is only towards their owners; everything else is incidental. But the chairman knows better than we do. 

The Tata group sells from salt to trucks, covering the entire gamut of consumption. There are 17 companies listed on the stock markets, and have a total market capitalization of Rs.10,401 b ($148 b). In addition to these companies, there are many private organizations - including not-for-profit - set up to serve the society. With more than 700,000 people, the group is probably the largest private employer in India. That is commendable. 

This post analyzes only the publicly traded entities within the group. These 17 companies have total revenues of Rs.6,496 b and total earnings of Rs.560 b (March 2018). That implies the group is priced at an earnings multiple of 18.55. Although price-sales multiple is not the best measure - enterprise value to sales is better - 1.60x seems quite interesting.

Yet when we look a little closely, we can note some peculiarities. Consider this: Just one company makes about 70% of the group's market value. With Rs.7,185 b market cap, TCS stands singular. It is a little hard to believe that the rest of the group - 16 publicly traded companies - are only 30% of value, and are collectively worth only Rs.3,216 b.


One of the most important measures of how well a company is managed is the return on capital, and TCS stands out with stellar performance. It also generates large amounts of free cash flows. Titan also has superior return on capital over the past decade. But then market's inconsistency in pricing equities is evident: TCS contributes (Rs.258 b) over 45% of the total earnings of the group and Titan (Rs.11 b) only 2%, and yet, TCS is priced 27x and Titan 81x earnings. This is not to say that only earnings matter for pricing stocks; what I mean to say is that Titan is richly priced as of now considering its growth prospects and return on capital.


Tata Motors revenues for 2018 were Rs.2,954 b (over 45% of total group revenues) and earnings were Rs.89 b (over 15%); similarly, Tata Steel too had significant revenues and earnings for 2018; but both are priced less than 6x their earnings. For Tata Steel it is understandable because it is in the cyclical business, and its average earnings over the decade have not been impressive, and we are never certain about timing of commodity cycle. For Tata Motors, the situation is different; having had some good times through Jaguar, Land Rover in the past few years, with slowdown in JLR business in its key markets, the business is faltering. A large amount of capital is required for its ambitious electric vehicles project, and it is not coming through easily. We are not sure if those revenues, earnings, and more importantly, free cash flows are going to be large enough to price its equity. At the moment, though, Tata Motors is worth just Rs.519 b. 

If return on capital is less than cost of capital over a long period of time, it is not possible to have free cash flows. No excess returns, no free cash flows. Tata Steel and Tata Power have failed in this test. Tata Communications is worth Rs.147 b, and its performance has not been impressive either. Tata Chemicals showing has been deteriorating over the past decade.

Tata Global Beverages and Tata Coffee, both, have not had decent growth. Their return on capital has not been good. Tata Global is priced at 24x earnings (Rs.119 b), and Tata Coffee at 14x earnings (Rs.15 b). They may well have potential going forward.

Voltas growth numbers haven't been good, but it is priced about 30 times earnings. We haven't got much to say about Indian Hotels which is priced rather rich and is worth Rs.165 b now. Trent has low return on capital and free cash flows over the past decade.

Tata Elxsi and Tata Metaliks are performing well, but aren't big enough to make meaningful contribution to the group; yet. Tata Sponge and Nelco are collectively priced only Rs.15 b, and aren't the best performers.

For 2018, TCS, Tata Motors, and Tata Steel contributed about 85% of the total group revenues and earnings. In July 2017, I noted what would happen if TCS falters and JLR slows down. Well a little over a year, and TCS is doing fine, but JLR is actually faltering.

Yes, the Chairman is right, the group needs growth. But growth requires capital for reinvestment, and more importantly, for growth to create value, it has to show excess returns. Superior return on capital and free cash flows.

Tata group, no doubt, is a significant contributor to the Indian economy and society. It intends well and means well. With the change in focus, we are confident that the group will emerge stronger than before. 

Wednesday, February 13, 2019

adag, and market inefficiency

reliance power
Reliance Power operates power plants and is also involved in distribution of electricity. In early January 2008, Reliance Power came out with an initial public offering primarily to fund its power projects across the country. In February 2008 the stock got listed, opened at a high of over Rs.500 per share, but closed the day at just over Rs.370. This was the largest IPO at the time which collected over Rs.115 b through issue of 260 m shares. During February and March 2008, the stock price saw a high of Rs.599.90 (BSE) and a low of Rs.303 (NSE). 

To make up for the loss, the company issued bonus shares to all the minority - that excludes promoters - shareholders in the ratio of 3:5. That makes the high price adjusted to bonus to Rs.375 and low price to Rs.189, and the market capitalization of the business to Rs.905 b (high) and Rs.457 b (low) in 2008. As of now, the stock is trading at Rs.10.75 and the market cap is Rs.30 b. That's a colossal loss. The promoters own 75% of the business, and over 80% their shares are pledged. 

It was generous of the chairman to give bonus shares to the shareholders when it was clearly not required. If the shareholders thought the business was good enough at Rs.450 per share, they would have got their expected rate of return, never mind the blip in the stock price. That the issue price was too high was something investors had to check for themselves. Even the timing of IPO wasn't considered right which had the makings of the global recession. However, the long term fall in stock price is not attributed to these events, but the business itself.

reliance infrastructure
Reliance Infrastructure is involved in power plants, metro rails, airports, bridges, and toll roads. The company acquired BSES in 2002 and sold its transmission business in Mumbai in 2018. In January 2008, its stock traded at Rs.2,485.75; that was nearly Rs.600 b for all equity. Now the stock price is Rs.112.30 and the market value of equity is Rs.29 b. Down 95%. The promoters own about 48% of the business, and over 80% of their shares are pledged. 

reliance communications
Reliance Communications emerged from transfer of telecommunications business from Reliance Industries on a going concern basis, and it shares were listed in early 2006. In January 2008, the stock was priced nearly Rs.800, and the equity was priced over Rs.1,500 b. It is trading less than Rs.6 per share now, and the equity is worth Rs.15 b. Down 99%. The company has filed for bankruptcy this month as there have been too many hiccups in its attempts to sell assets to repay its enormous debt. The promoters own about 53% of the business, and 30% of their shares are pledged. 

reliance capital
Reliance Capital is a financial service company operating in asset management, mutual funds, stock broking, wealth management, insurance, and finance. In January 2008, the stock was trading at Rs.2,762.60, and as I write this post in February 2019 it is quoting at Rs.136.50. The market value of its equity has fallen 95% from Rs.678 b to Rs.35 b. The promoters own about 52% of the business, and 75% of their shares are pledged.

reliance naval 
Reliance Naval & Engineering is into shipbuilding business. After Reliance Infrastructure acquired 17.66% stake in Pipavav Shipyard in March 2015 for $130 m, it came out with an open offer, and the ownership now stands at about 30%. The company operates as a part of the ADAG group.  In August 2010, the stock was trading at Rs.116.20 and in December 2015, at Rs.100.25. The market cap has changed from Rs.77 b to just over Rs.6 b. Down over 90%. All of promoters shares have been pledged.

reliance home finance
Reliance Capital owns 48% of Reliance Home Finance, and the total promoter holding is 75%. As it was spun out of Reliance Capital in September 2017, each share held in Reliance Capital got a share in Reliance Home Finance. The stock price has fallen from Rs.107.20 (September 2017) to Rs.24.30. That's reduction in market cap of 77%. The company is worth about Rs.12 b now.

reliance nippon life
Reliance Nippon Life Asset Management is owned by Reliance Capital (43%). In January 2018, the stock price was Rs.318.30. As of now, it is 50% down and the market cap of the company is Rs.96 b.


The promoters ownership has proportionately fallen to Rs. 115 b as of February 2019.


Like we noted the long term fall in stock prices is not attributed to any macro events, but the businesses themselves. For whatever reasons many of the businesses have been dealing with unmanageable debt, and as is their wont, the markets have also punished those that should not have been.

Nevertheless, such a steep fall in stock prices appears to be unwarranted, and this might be an opportunity for investors having faith in the management. A decade and more, these businesses should come out of their problems and emerge good. But then again such contrary views require bold moves, and also depend upon the opportunity costs. 

Friday, February 8, 2019

tata motors, and jaguar, land rover

The market value of Tata Motors equity was Rs.575.954 b as of yesterday. As I write this post, while markets are still open, it is down to Rs.472.066 b. That is an 18% fall. 

The company has two types of shares: 2,887.348 m ordinary common shares and 508.502 m differential voting rights shares. The DVR shareholders are entitled to one vote for every 10 such shares held and dividends of 5% more than that are entitled to the ordinary common. However in the absence of any dividends distributed to the ordinary, there will be no dividends for the DVR shareholders. 

In June 2008, Tata Motors completed its acquisition of Jaguar Land Rover business from Ford Motor Company at a net consideration of $2.3 b in an all-cash transaction. The acquisition was on a cash-free, debt-free basis, but, Ford contributed $600 m towards the pension plans. In November 2008, Tata Motors market cap was at a low of Rs.65 b (less than $1.5 b at the 2008 exchange rate). That itself should have made the consideration over the top. But the chairman had said it was a momentous time for all at Tata Motors. Another Tata company, Tata Steel, had just acquired Corus for $12 b (608 pence per share against the original offer of 455 pence) in 2007. So the group was in an acquisition binge.

But then in 2008, JLR was losing money. Surprisingly, Ford had failed to monetize JLR. The financial crisis and subsequent recession meant demand for luxury cars (Jaguar) and SUVs (Land Rover) was slowing down. Confidence in the credit market was the lowest. Borrowers struggled for credit, and lenders were worried about defaults. The combination was unusual because Tata Motors was in the mass segment and JLR in the premium segment, and the synergy seemed to be out of place. For the first financial year after acquisition (March 2009), Tata Motors posted a net loss of Rs.25 b. The company also ended up with debt of Rs.219 b. 

Raising cash was a priority for Tata Motors. The sale of 1.3% holding in Tata Steel to the parent, Tata Sons, for Rs.4.85 b and a rights issue of Rs.41 b was not much compared to the capital needed. A turnaround in JLR was what was required.

And what Ford could not do for years, Tata Motors did in two years. Earnings for 2011 were Rs.92 b; for 2012, Rs.135 b; and for 2013, Rs.98 b. The catch was that Tata Motors local business wasn't doing well. In fact, it posted huge losses in 2015 and 2017.


JLR was turned around all right. But there was a cost to it. A good business is one which earns a high rate of return on its capital employed, and does it consistently. In this respect, we don't think Tata Motors standalone has been doing well. Tata Motors consolidated earned about 15% on equity for 2018. But then that was largely due to contributions from JLR as we have seen. Both revenues and earnings from JLR have been disproportionately large compared to the consolidated numbers. Whether it will continue in future is a question.

Tata Motors has poured in billions of dollars in JLR since acquisition. Yesterday when it released its 3rd quarter results (December 2018), the markets had a surprise. The company said that the carrying value of its capitalized investments were brought down by 3.1 b euros ($3.5 b). When the assets are not expected to bring enough cash flows to justify their carrying values, they are brought down to the level equal to the present value of future cash flows, and such impairment is taken to the income statement. This is a non-cash adjustment that does not affect the statement of cash flows. Yet, the indication is the JLR business may not do as well in future. One of the primary reasons has been slow down in China which was its biggest market. Tata Motors reported Rs.269.61 b loss for the quarter. JLR reported a net loss of 3.1 euros implying no profits even before this one-time impairment loss. The standalone business reported a profit of Rs.6.18 b.

JLR has announced plans to come out with electric vehicles on all models. It will require a lot of capital for investment though. Tata Motors domestic business is doing better than before. Time will tell whether each business will be able to justify the capital invested. For that to happen they will have to show high return on capital and generate large free cash flows on a consistent basis. We hope that the group will be able to wither the past and come out on better terms.

Friday, December 21, 2018

pabrai, care ratings, and sell decisions

I am going to keep this post short. Care Ratings is trading at Rs.973.25 now. The low price was Rs.950.10 in November 2018 and the high price was Rs.1,430 in January 2018. So much has happened in during the year in the Indian markets too. 

I don't know why Mohnish Pabrai bought Repco Home Finance during April-September 2018, and I don't know why he sold much of the shares in November 2018 for loss. 

But then again I don't know why he bought Care Ratings. As of September 2018, the company had 29.461 m shares, and Pabrai funds owned 2.369 m shares (over 8%). 


Now I don't know why he sold shares in December 2018 for loss.


He sold 845 k shares at Rs.985.75 apparently for some loss on 20 December 2018. There are certain things in Pabrai's favor. He is a smart investor with historical returns behind him. He sounds good when he talks and writes; there aren't any stupid, irrational concepts that he brings in his philosophy. He is a long term investor, not bothered by short term events. And he is a huge Buffett and Munger fan.

So what made him sell Repco and Care Ratings in such a short time? I have noted earlier that he may have a better idea to deploy his capital. But then, there is another thing that I think may have triggered his sells at loss. Is that tax-loss harvesting? I am not too sure, but Pabrai is a smart investor. 

Sunday, December 16, 2018

ny times business

New York Times was founded in 1851, and the company got listed as a publicly traded stock from 1969. The equity of the business is worth about $4 b today. In 2007, it was worth $3.8 b (high) and $2.3 b (low). In 2012 it hit some low times when the high market value was $1.6 b and low was $889 m. For the year 2011, it posted operating profits of $162 m and net loss of $40 m. There were several items of exceptional nature in that year probably. The broader point though is that there hasn't been much for its stockholders during the last decade.

Print media has been going through some tough, very tough times, and the digital media does not seem to be too promising as a viable business either. NY Times has been trying to transform itself onto digital platform, but the results are not interesting. The competitive advantages are lacking in media business in general.

In 2008, its advertisement revenues fell about 13%.


And by 2012, they were less than a million dollars.


For 2017, its latest reported financial year, the advertisement revenues were $558 m, but increase in subscription revenues have ensured total revenues stayed on course.


It had operating profits of $188 m, debt of $250 m, and the present value of its non-cancelable leases was  $47 m. It also had cash and non-operating assets of $735 m. The operating margins have improved over the years to about 10%. 

But the return on equity has not been encouraging: It was 21% in 2007; 17% in 2010; 26% in 2012; 10% in 2013. Other than for these years, the return on equity has been pretty dismal. If this has to continue, the business is not going to be a profitable venture for its shareholders. 

But then, who are its shareholders? The business is controlled by the Sulzberger family through a Trust. The company has two classes of shares: class A and class B.


While both classes share equally in profits, the voting power is controlled by the class B owners, and the family trust owns more than 90% of class B shares. That means any takeover threat is virtually eliminated. Over 50% of class A shares are owned by 6 investors: Vanguard, BlackRock and Darsana Capital own (8% each), Fairpointe Capital and Wellington Management (5% each), and Carlos Slim Helu owns over 16% of class A shares.

As far as the family trust is concerned, there is a case for retaining control for emotional and prestige reasons. But those 6 outside investors have some $2 b stuck in the business earning quite low on its equity. They may have their reasons, but it does not look fit for capitalists.

After a long time, total revenues grew year on year. 2017 saw over 7% increase in revenues, and the stock has hit $25. However, purely on pe terms, the price looks exorbitant. After denying dividends for 4 years from 2009 to 2012, they have been restored and increasing from the year 2013. The latest dividend per share is $0.16.

Free cash flows from business have not been great. NY Times generated some cash in 2012 and 2013 through sale of About group for $300 m and New England Media group for $70 m, and debt was brought down to $250 m.

At present, the equity is $900 m and non-operating capital is $735 m. Let us suppose that $250 m debt is fully paid off through sale of non-operating assets; there will be savings on finance costs. The business then will have $415 m operating assets and $485 m non-operating assets financed by $900 m equity. Now for the shareholders to make their investment business sense, the return on equity should be more than risk-free rate of return which is about 3%. Let's say the investors expect 8% return on their capital. The total return on equity should then be $72 m of which about $15 m (3%) will be provided by non-operating assets. The balance $57 m will have to be supplied by operating assets.; that is a return on operating capital of 14%.

It will not be easy to sustain 14% rate of return on capital for long though. A much better choice probably would be this: Excess capital which is deployed in non-operating assets may be used to pay additional dividends or buyback shares. Let's assume it will be used for dividends; so $485 m will be a windfall for the shareholders. Now the business will have only operating assets of $415 m financed entirely by equity. The expected rate of return is 8%. The business will have to generate only $33 m in profits; $24 m less profits will be relatively easier to make. Payout all profits after mandatory capital spends as dividends. Business will be mature, and valuing it will be simpler. Keep the story going as long as it is economically viable.

The outside investors will have to have faith that New York Times will be able to deliver their expected rate of return. The family trust is going to be probably fine since its objectives are different from class A share owners. 

Thursday, November 29, 2018

yes bank, market, and rating

Yes Bank is taking its toll; rather its investors are. It is becoming too much, or it's not? In September, the RBI said, weak compliance, weak governance, and wrong asset classification. The CEO had to step down without extension of tenure. 

It was enough for the stock to plunge. On 28 September, the stock was staring at Rs.165 per share. Things seemed to be better in October and November as the stock was trading at around Rs.200, not moving much. October's high was Rs.248.90; and low was Rs.180.70. November's high was Rs.227.90. But then...

Some of the board members resigned later in November. The stock closed below Rs.200 for the first time in the month on 16 November. Here's the snapshot of the skin in the game that the board exhibits (as of March 2018).


Not all directors own shares in the bank, and those who own have insignificant number of shares.  This is not new to only Yes Bank; most of the companies in India have board members and even executive officers who do not own meaningful number of shares. I find that surprising, but want to keep the story for another day.

Whereas look at the volume of shares owned by the CEO and the CFO. I wouldn't conclude that they will act against the interest of their fellow shareholders. I don't know the inside story; but the RBI's remarks regarding corporate governance are serious, and should be taken seriously. There is time to repair the damage caused, and that should be the new CEO's top priority.

On 26 November, it was reported that the CEO, who is also one of the promoters, had raised money from two mutual funds through his associate firms by keeping his stake in Yes Bank as some sort of a guarantee. It was interpreted by the market as shares pledged, but not reported. This perception was bad enough for the stock, and it closed the day at Rs.187.90.

On 27 November, Moody's downgraded Yes Bank's ratings citing corporate governance and growth concerns. The stock had to react; Rs.182.65. On 28 November, Rs.162.10. And today, 29 November, it quoted as low as Rs.146.75, but closed at Rs.160.45. The trading volume was 292 m shares. I don't have any respect for the rating agencies, but the truth is that it becomes difficult for the downgraded business to raise cash on favorable terms; the cost of borrowing goes up. 

The two promoters must have felt it too. Let's do some math. Rana Kapoor, including Yes Capital and Morgan Credits, owns 245.875 m (10.65%) shares in the bank, and Madhu Kapur, including Mags Finvest, owns 213.987 m shares (9.27%). 

Based on the 20 August 2018 price of Rs.404, the market value of Rana Kapoor's shares was Rs.99.333 b ($1.419 b); and Madhu Kapur's was Rs.86.450 b ($1.235 b). As of 29 November, the respective market values are Rs.39.450 b ($563.580 m) and Rs.34.334 b ($490.489 m). It is still a lot of wealth. But, when the stock price falls 60% from its high, the value of shares goes down with it. Yet, it is important to remember that these are only paper losses until they are realized through transaction. 

Is the reaction from market an overreaction of some sort? While time will tell us about it, I guess, there are a lot of people out there on the media and social media giving enlightened opinions about how a badly managed business is a bad investment. Well, when the stock was going up, these naysayers were probably talking about some other stock. Never mind, it is the business of people to talk about other people. 

Every business has a price. A good business has a price, and a bad one has another. I am not too sure at the moment whether Yes Bank is a bad business. Yet, at the price it is quoting now, probably there is some value to be claimed by patient investors. Didn't I say something like that in early October too?

Wednesday, November 28, 2018

kotak bank stake conundrum

Kotak Bank has been a well run bank among the private banks of India. With gross npa of 1.94% and net npa of 0.73%, its track record has been extraordinary. The net margins are over 4%; business is growing. And the market is willing to pay the price for its equity. At current prices, it doesn't come cheap in excess of 4 times September 2018 adjusted book value. 

Yet I reckon, if it grows at 15% in the next 3 years and market allots a pb of 3.50, the investor will have about 8.50% annualized return. Is that enough, is a question for the investor as of now. 

However, with the RBI asking the promoters to reduce their stake from 30% (current) to 20% by December which we see likely not happening by the time, there are chances that the stock prices might get lower. Time will tell whether they will become attractive enough to meet the investor's opportunity costs.

This article presents options available to the promoters well; however, I don't think this will leave investors on edge. Investing isn't a short term game; so they should relax and take it easy. If they believe in the capabilities of the promoter manager, they should be fine.

At the moment though, the promoters have the following options to keep the regulator happy, unless the RBI accepts the current status of Rs.5 b perpetual non-cumulative preferred shares.


The promoters have the option of selling 191 m shares or issuing 477 m fresh shares in order to meet the RBI's directive. I am assuming that fresh issue will have to take place at discounted prices. With the first option, the promoters will have challenge of dealing with some Rs.224 b cash; they will not only have to pay taxes on it, but also will have to check out the alternative investment opportunities. If fresh shares are issued, the bank will get about Rs.530 b in cash which can be useful in meeting its growth targets. But then, Kotak bank has a Tier 1 capital ratio of 17.04%; so it already has enough cash for its growth requirements. 

It is an uneasy conundrum for the promoters for sure. To keep able promoters' stake high enough is a good idea so that investors benefit from aligned objectives. Whether 30% or 20% is a good stake, will have to be dealt with independently. Yet, the RBI cannot have a separative guideline for one bank and another for other banks. 

Kotak bank stock had a high price of Rs.1,417 in July 2018. I find that even at current prices which are much lower, it is not cheap. But then investing is a waiting game, isn't it?

Thursday, October 4, 2018

yes bank's september

Never mind what happened to the Indian markets today. The nifty-50 fell 2.39% to end at 10599.25. Yeah it fell yesterday too. Let's keep the index story for another day. On 6 September, Yes bank traded at a high of Rs.347.80. On 20 August, at a high of Rs.404 per share. Things were looking alright for the bank until 21 September. The day before was a market holiday. On 19 September, the stock closed at Rs.319.20.

On the same evening, the bank reported that the RBI had rejected its request to extend the CEO's tenure by three years. The next trading day on 21 September, the stock tanked 29%, and closed at Rs.226.50 per share, equivalent of a loss of Rs.213 b in market value. Can one person be so important for a publicly traded, large banking business, or was it just the market's whims? The quantity traded on that day was over 293 m on the NSE, compared to the average of less than 30 m during the previous seven trading days.

As per this report of that fateful day, the bank was cited three reasons for the RBI's deadline for the CEO's tenure until 31 January 2019: Weak compliance culture; Weak governance; and Wrong asset qualification. The allegations seemed too brutal, and the bank made a new low of Rs.197.25 on 25 September when the board was to meet for the future course of action. 

However, 28 September was more special when the stock quoted at Rs.165 at some moment, but closed the day at Rs.183.65 per share. The market capitalization of the bank stood at Rs.423 b, some 54% down from its August's high. Too much, too soon? Is the market crazy, or is there more to this?

As of June quarter, Yes bank had impressive performance to show: Gross npa 1.31%; Net npa 0.59%. Net npa, security receipts and standard restructured assets totaled 1.52%. Yet, herein lies the catch. If these numbers are good, at the current price of Rs.215 per share, the stock is trading at 2.15x its adjusted book, a reasonable price having potential to yield better returns in the next 2 to 3 years. 

If the asset quality is worse than it is reported, it becomes a little complicated. The value becomes a function of how the book looks like. For instance, if the net asset quality is worse off to say, 3%, the current price becomes 2.50 times its adjusted book. If 5%, the price will be 3.19 times the adjusted book. Naturally, the returns will be impacted. That is why the management trust factor is so important when it comes to valuing banks.

The bank's capital raising plans have been held up because of the story that has unfolded. At the moment, therefore, the capital ratio is not the best which means the bank's near term growth will be somewhat subdued. After new capital, the bank should be able to move on to the growth path. Its return on assets (1.35%) and return on equity (16.40%) are pretty decent. There is a reason to believe that this should continue. 

On 1 October though the bank released its unaudited details for the latest quarter, and noted that its gross npa were stable compared to the previous quarter. 

In the meantime, there is no dearth of recommendations:


Time will tell whether Rs.215 is a good buy, or a great buy, or something else. It looks like there is an opportunity here for the investors if they are willing to show some patience after picking it. 

Tuesday, September 18, 2018

lehman, financial crisis 2008, and more

Lehman's history
Lehman Brothers was founded in 1850, and became an important trader in cotton during those times. Later it focused on trading and brokering of commodities. The firm dealt with great depression, and came out having survived. The business of venture capital and underwriting of capital issues was steady and successful in the subsequent years. By 1975, Lehman had became a prominent investment banker for the American businesses. 

American Express acquired Lehman in 1984 for $360 m to form Shearson Lehman American Express. In 1988, the firm merged with EF Hutton stock brokerage to form Shearson Lehman Hutton Inc. 

Before the initial public offering, the banking and brokerage operations were divested of, and retail brokerage and asset management business was sold by American Express. Lehman Brothers Holdings Inc. became a publicly traded firm in 1994 with Richard Fuld as its CEO. His 14-year stint as CEO had to end with filing for bankruptcy on 15 September 2008. Before that, the firm fended off rumors of cash crunch due to the collapse of Long Term Capital Management in 1998 as fake news. By 2007, Lehman had posted record revenues, earnings, and earnings per share for four consecutive years. Fuld became a hero after leading the firm to post 14 consecutive years of profits after it had reported a loss of $102 m in 1993. Little did the market know of the amount of leverage used to drive returns on equity. The asset management business was revived in 2003. In 2007, Lehman had revenues of over $19 b and posted record high earnings of $4.2 b. 

Perhaps things would be fine had it not ventured into the lower grade mortgage lending business. Of course it was lucrative, and seemed like a good idea at that time. The Alt-A mortgage, considered lower than prime but better than subprime, began after Lehman acquired Aurora Loan Services in 1997. Later in 2000, BNC Mortgage LLC was acquired, and Lehman became a subprime mortgage lender. These lower grade, higher risk mortgage lending operations had a stunning growth story: Lending in 2003 was $18.2 b; in 2004, it was $40 b; and in 2006, both Alt-A and subprime loans comprised more than $40 b per month. Quite naturally, Lehman started 2007 with too much of risky assets supported by too little of equity. Any good year with this capital structure would yield enormously high earnings for common shareholders; and it did, in 2007 of about $4.2 b. Any bad year would be of enormous losses. And a very bad year, would let the course to bankruptcy; and it did in 2008. 

2008 operations
The winding down of BNC subprime operations in August 2007 perhaps came a little too late. Consider this: Lehman posted profits of $489 m in the first quarter of 2008. Citigroup posted losses of $5.1 b, and Merrill Lynch had $1.97 b losses. In the second quarter though Lehman reported record losses of $2.8 b which came after a very long time. Revenues for the quarter ended May 2008 were $6.240 b, and interest costs alone were $6.908 b. It had $6.513 b of cash available for operations. Total assets were $639.432 b, of which $13 b was cash deposits mainly with the regulatory authorities. In effect, its net operating assets were: Financial instruments and securities of $269 b; Collateralized agreements of $294 b; and receivables of $42 b; totaling $605 b. You couldn't do much with property and equipment ($4 b), intangible assets ($4 b), and other assets ($5.8 b). During the quarter, Lehman lost $17.899 b of cash from operations which was made good by debt.

In June 2008, Lehman raised $4 b of common stock at $28 per share, and $2 b of non-cumulative preferred stock carrying 8.75% coupon, which had a mandatory convertible clause. Apparently, this capital raising was not good enough because its statement of financial position as of May 2018 looked like this: Assets ($639.432 b) financed by common equity ($19.283 b), preferred stock ($6.993 b), and debt and other payables ($613.156 b). Just 3% common equity meant that asset losses of only 3% would wipe out entire equity; a very vulnerable situation to be in.

The auditor's report dated July 2008 based on their review of May 2008 (quarter) operations, and the report dated January 2008 based on their audit of November 2007 (year) operations, expressed unqualified opinions on the financial statements. There wasn't a note on Lehman's going concern issues.

Lehman reported Tier1 capital ratio of 10.7% and risk-weighted capital ratio of 16.1% as of May 2008. This wasn't reflective of the risks that the firm was up against. As long as property prices remained high it was fine. If prices were to fall, Lehman would need cash to make good on margins to its lenders. When prices came crashing, the firm would need significant amounts of cash on short notice. Inability of the original individual mortgage borrowers also had a role to play which had cascading effects on property prices and consequently on the bundled mortgage assets prices; there was a reason they were called subprime.

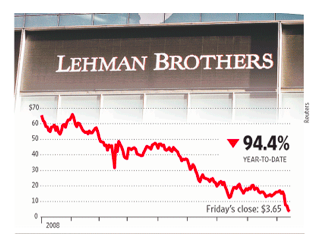
Lehman stock prices started falling, and the subsequent downgrades on Lehman by the rating agencies meant its derivative contracts demanded billions of dollars in collateral. By 9 September 2008, Lehman was worth only $6 b while it began 2008 with a market capitalization of over $35 b.


Nevertheless, here's the thing: If the markets trusted on Lehman's ability to recoup, even if it were to take a long time, it would have been ok. However, it was not to happen. Lehman lost on its credibility to raise short term cash, and there was no other choice. 

No bail out
Even the government turned the other way. It would rescue Fannie Mae and Freddy Mac; both firms had owned or guaranteed about $6 t of the total $12 t US mortgage market. It bailed out AIG. It also facilitated the $50 b Merrill Lynch buyout by Bank of America. But not Bear Stearns and Lehman. The first to go was Bear Stearns when the government let JPMorgan Chase buy Bear Stearns for $2 per share. Warren Buffett bailed out Goldman Sachs by investing in its $5 b preferred stock carrying 10%, which helped boost the firm's credibility and made its capital raising easier. All the firms that survived were beneficiaries of the government's $700 b troubled assets relief program bailout. 

Of course, the government thought Korea Development Bank would rescue Lehman. When it did not, the stock price crashed below $8 per share. It also hoped that Barclays would buyout Lehman which did not happen thanks to the veto of the UK regulators. 

Then the bankruptcy was made inevitable; 15 September 2008 and Lehman became part of the history being the largest bankruptcy of all time.


The S&P-500 fell more than 4.5% (source: Yahoo finance) on the day, and so did the Dow Jones which fell from 11421 to 10917.

Bankruptcy meant $0 stock prices, and this is how they panned out.


Subsequent to the filing, Barclays bought selected US assets for $1.29 b, and Nomura bought Lehman's Asia operations for $225 m, and parts of European operations for nought ($2 nominal). 

What if
I sometimes wonder what would have happened to Lehman and the financial markets if the US government had bailed it out. That is to supply cash and fill liquidity, and own equity until Lehman was able to get back on its feet. When asset prices and markets recovered, as they did, Lehman would repay its debt (equity) back to the government, and either remain a privately held firm or issue shares to public to operate as a listed entity. Alas, it wasn't to be. And we have a number of lessons to learn. 

Lessons that markets don't learn
The first and foremost is never to be at the mercy of someone else. This position of weakness is almost always caused by excessive leverage compared to own capital. The second is never to trust the governments to come and support during desperate times even while they choose to discriminate. The third is never to be in a business that is mainly dependent upon hope, greed, and the greater fool; most likely, the business itself would end up being one such fool eventually. Lehman, along with other firms that fell, unfortunately did not have the time to learn these lessons. Yet, I hope that those firms that did survive have learned. But then, don't we know that what we learn from history is that we don't learn from history?

Tuesday, August 14, 2018

tcs, and its glory

TCS is planning a buyback worth Rs.160 b at a price of Rs.2,100 per share. That should reduce its March 2018 cash to Rs.272 b. Never mind the current cash position, it's only 3 months since after all. Let's work with the March 2018 numbers. It had 1914 m shares then; subsequently in May 2018, it carried out a 1:1 bonus; so there are 3828 m shares outstanding as of now. After the buyback they will be 76.1 m lower. Is Rs.2,100 a fair price for the stock? There are two things necessary to do a buyback: First, it should have excess cash which TCS has in plenty. Second, the price should be lower than its intrinsic value. If not, the selling shareholders will benefit. That is a conundrum for both the managers and shareholders. What the heck is the value per share of the stock? The market price is about Rs.2,000 now. 

TCS had revenues of Rs.1,231 b in 2018. More than 80% of that comes from Americas and Europe. It serves the services sector much more than the manufacturing sector, with leadership in banking, finance and insurance space.


The revenues increased by 14% and 18% annually in the past 5 and 10 years respectively. However, it did clock its lowest revenue growth in a decade at 4.36% last year. Is that any indication? In fact in 2017 also the revenue growth was lower than double digits. 

TCS does not spend much on research and development. It is about 1% of revenues. I prefer not to make any adjustment to its operating profits. Operating margins are pretty stable at around 25%. Earnings per share was Rs.25.68 (2008), Rs.70.99 (2013), and Rs.134.91 (2018); these are all pre-bonus numbers. It had a double digit growth in the past 5- and 10-year periods. Yet, the growth was as low as 1.12% for 2018. This was despite a buyback of 56 b shares at a pre-bonus price of Rs.2,850 per share in May 2017. Since then the stock has gained 40% to date; the buyback turned out to be a bargain for the existing shareholders. Net margins have also been stable at around 20%. Return on capital and equity have remained very healthy. It had a book debt of Rs.2.5 b, and lease debt of Rs.37 b. Yeah, TCS has some non-cancellable operating leases. 

How much can its EPS grow in the next 10 years, for instance? Adjusted to May 2018 bonus, if it grows at 10%, it will be Rs.175 per share after a decade. At a multiple of 25 as a reward for growth, the market price will be Rs.4,375, giving an annual return of 7.25% for the period. Make it 9.50% including dividends. Are we happy with that rate? What are the alternative opportunities available? What if the growth rate is 7%? Well, the return also will be lower at about 4.25% including dividends, assuming a lower multiple of 20 for lower growth. That's the risk all equities carry. 

Historically TCS has been priced at higher price-to-fcff multiples. Let's assume that a multiple of 20 is fair as it stands today as an aging information technology services business, and that its average free cash flows annually are Rs.200 b. If these free cash flows grow at 10% annually over the next decade, our expected return from the stock will be about 7.55% for the period.

I also did a dcf valuation for the business. At its current price, the implied rate of return for the stock is 7.36% based on my assumptions regarding growth rates and reinvestment of course. 

If our expected returns are higher than 10%, we need to expect higher growth rates in revenues, earnings, and cash flows from the business. Is that possible? TCS managers have found Rs.2,100 as a fair price for the share buyback; may be they know more about its story than we do. 

TCS was available at Rs.709 b in 2008, at its low price. In 2013, the low price for the business was Rs.2,082 b. Today it is priced more than Rs.7,500 b. That's hypothetical because Tata Sons owns more than 70% of the business; and it ain't going to sell. In addition, TCS paid out a total of Rs.663 b in cash dividends in the last decade. Of course it has been a super business. Whether TCS and its peers in India are aging IT services businesses which have matured already, or there is more innovation and growth in store is the question before the analysts.