Pages

Tuesday, June 30, 2015

airbnb, how much to pay for growth

Airbnb recently raised $1.5 b from private equity, valuing its total equity at $25.5 b. It is expecting revenues of $0.9 b, compared to Hilton's revenues of $11.5 b and Marriott's $14.8 b. Clearly, the investors are seeing something in Airbnb that they don't see in Hilton and Marriott. That is the growth in the future. 

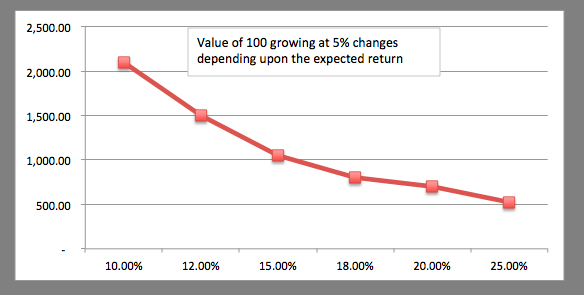
We know that equity valuation is all about estimating future cash flows and looking at their present value. Usually, the expected return for private equity is quite high compared to the actual cost of equity of the invested firm. That is why, they look for the platforms where cash flows are likely to be much higher than others. The higher the growth rate in future, the higher the investment from private equity. 

And we also know that all growth does not create value. For growth to create value, it has to reinvest capital efficiently, which is measured by return on capital for the firm and return on equity for the equity. Airbnb's expected annual growth rate in the next few years is 90%, compared to Hilton's 9% and Marriott's 8%. This has made Airbnb a natural playground for the private equity. The investors have valued Hilton at $27 b, and Marriott at $20 b. These hotels had operating margins of 15.93% and 8.4% respectively for 2014. Hilton and Marriott are also the biggest hotel companies in the Fortune 500 list after Las Vegas Sands.

Both Hilton and Marriott were started centuries back, while Airbnb is less than ten years old. Of course, that does not mean much considering the disruptive transformation that has been taking place over the globe. Brian Chesky is a cool guy, and sure, he has plans to disrupt (that's cool these days) the industry.

To justify an equity value of $25.5 b, what should be the revenues, operating margin, and reinvestment for Airbnb in its high-growth years, and then in perpetuity? Airbnb itself has estimates of $10 b revenues by 2020 and profit visibility by that time, which means it is not going to be profitable for another 5 years. That it is not going to payout any dividends soon is given. Industry average operating margin (12.50%), return on capital (7.50%), and sales-to-capital of 0.75 are not applicable to Airbnb considering the fact that it is not going to own properties, and consequently, would remain asset-light compared to the conventional hotel companies.

Airbnb has so far raised total equity capital of $2.3 b. I tried on a spreadsheet to bring $10 b revenues by 2020 (as estimated by the company) and $14 b by 2024. I also gave much higher return on capital (therefore, much lower reinvestment), and much higher operating margin than Hilton and Marriott. I assumed immediate profitability as opposed to the company's estimates of by 2020. I also maintained high return on capital and operating margin until perpetuity. Finally, my cost of capital estimates were modest (and nothing like the private equity). This was an attempt to give my best shot at getting close to $25 b in value. Heck, I got only $14.80 b. I have to do better the next time.

But wait, at $14.80 b of equity value, it is still a unicorn, is it not? May be I should work towards valuing the firm more realistically. Too bad, I can't, because it is way beyond me to estimate its future. I can play around with these stuff,  and I like that, but, it is not my playground; my game is different.

Of course, the private equity knows it better, Chesky has already hinted about going public in about two years. At what rate the public market investors are going to be squeezed remains to be seen. 

Monday, June 29, 2015

keeping track of predictions, like a joke

Sometimes you want to have some fun, have a hearty laugh. That is what I had intended to do when I first kept track of some predictions made in 2013. 


Nifty is at 8318.40 today. 


I suppose, we have not witnessed a 1990-like situation in Asia, yet.

The current account deficit was $32.4 b in 2013-14.

Rupee has not hit 69 a dollar, yet.

I am not sure whether or when the stalled infra projects were cleared, but, here's some news.

So much for predictions. The joke is obviously on those who...

Moral of the story: No one can consistently forecast the future course of, well, any thing.

Friday, June 26, 2015

clariant, low or high pe

Clariant Chemicals is selling at an earnings multiple of 2.4 compared to the industry multiple of 5.34. If we do not consider 2014 numbers, its average historical low multiple is 10.44, and high multiple is 17.99. Here we go, the classic low multiple stock, a buy.


Or is it? It is very costly to jump to conclusions immediately based on what we see, in investing in particular. The low multiple is actually after considering exceptional items in the financial statements. This is one reason I don't rely on external sources for information. It is always good to get the required information from the original sources such as annual reports and company presentations.

In the last few years, Clariant has done significant restructuring of its business. Moving forward, it wants to concentrate on its core identified segments: Pigments and Colors and Dyes and Speciality Chemicals. 

Clariant acquired Masterbatches business of Plastichemix Industries (a partnership) for Rs.1,310 m in April 2014.

In September 2013, it sold its Textile Chemicals, Paper Specialities and Emulsions (TPE) business (part of Dyes and Speciality Chemicals segment) to Archroma India Pvt. Ltd. for Rs.2,091 m.

In fact, Clariant has a history of exceptional items:


In 2011, it sold its manufacturing facilities at Balkum, and also sold its subsidiary.

In April 2014, it sold the business of Leather Services (again part of Dyes and Speciality Chemicals segment) to Stahl India Pvt Ltd. for Rs.1,560 m. 

Also in April 2014, it sold 87 acres of land (together with buildings and structures) located in Thane to Ishwer Realty and Technologies Pvt. Ltd (a subsidiary of Lodha Developers Pvt. Ltd.) for Rs.11,025 m.

In March 2015, it acquired Carbon Black business from Lanxess India Pvt. Ltd. for Rs.135 m.

Because of the massive restructuring carried out it is not possible to compare 2014 financial performance with the past performance. Nevertheless, the company incurred operating losses of Rs.87 m. This is before all exceptional items, and comprises results of its current core business model. 
The reason for loss as per the annual report: Highly competitive market segment, low turnover due to divestment businesses, higher raw material costs, rent, facilitation, depreciation and amortization costs associated with shifting of registered office and operations from Kolshet to Reliable Tech Park, Airoli and Vashere in Bhiwandi District and one time write-off of inventories, etc. have affected the operational profits of the company for the year 2014.
If the core business itself is going to be hit at the operational level, it is not a good sign. Yet, the company is optimistic about its coming years. While the managers note excess cash that is available for buyback, they do not mention (in the buyback notice of May 2015) whether they consider the current stock price to be cheap compared to the company's fundamentals; they have announced a share buyback program of Rs.3,400 m: Clariant is going to buy 3.58 m shares at Rs.950 per share.

While this announcement would probably fall under the investment operation of risk arbitrage, let us check whether the managers are right about the company's intrinsic value. Clariant had cash of Rs.10,444 m as of December 2014. With assumptions on perpetual growth for the operating cash flows and expected rate of return, in order to justify the buyback price, the free cash flows to firm would have to be between Rs.500-1,000 m (depending upon the assumptions).

Can Clariant generate those cash flows? I don't know. Its past free cash flows are probably not any guide to its future particularly because we don't have all the (past) information relating to its core business.

Monday, June 22, 2015

symphonomics, now what

Symphony is in the business of marketing of air coolers. It has a factory in Thol village in Gujarat, and an SEZ unit (capacity: 200,000 units) in Sachin, Gujarat. It also has manufacturing facilities in Mexico and North America. So it does manufacture, but not so much. In 2014, it probably sold more than 700,000 units. That's because it has a unique business model, which is asset-light. What it does is, it outsources its manufacturing to others (call them OEMs, and there are 9 of them), the total capacity for which is 1 m units. The key focus for the company is: research and development, product innovation, and marketing. Of course, it has to supervise those OEMs for quality and compliance. It acquired 100% stake in Impco S.de.RL.de.CV., Mexico through its wholly owned subsidiary, Sylvan Holdings Pte Ltd, Singapore. Impco is into manufacturing of industrial air cooling solutions. Symphony has a share of over 40% (volume) and 50% (price) in the organized residential air coolers market in India, and has presence in over 60 countries in Asia, America, Europe and Africa. It believes in robust product innovation, and has come out with new products each year; the company has over 23 models currently. It has a strong network of distributors, dealers, and retail chains, and has plans to double its network in the coming years.

Symphony is owned by Mr. Achal Bakeri and his family (75%); he is the Chairman and Managing Director. Rowenta Networks Pvt Ltd (2.86%) and Mathews India Fund (3.22%) are the largest shareholders after the promoter family. The institutional holding is about 8.50%. There were 34.98 m shares outstanding as of 31 March 2015. 

The board:

The managers:

Key management remuneration is about 0.50% of revenues. 

Symphony has the following subsidiaries:


Let's move on to the story now.

About eight years back, the company was incurring losses in its operations, and there was no cash. In 2014, it had revenues of Rs.5.33 b, operating earnings of Rs.1.22 b, and net earnings of Rs.1 b, and yes, it also had cash of Rs.2 b. In 2004, its equity was valued by the market at as high as Rs.50 m and as low as Rs.14 m, and now it is Rs.79.57 b. Some perspective: If you had invested Rs.1 m in 2004, you would have by now, Rs.1,591 m. Isn't this crazy?

What do you call it:

Mr. Bakeri has called it Symphonomics: Trust your vision; Transform your handicaps into opportunities; and break all rules.

Mr. Bakeri believes that when people have resources their first cooling product buy would be air coolers, and not air conditioners. He took the fundamental call that Symphony was not a manufacturing company, but a marketing company. Symphony's business model became asset-light with most of its production being outsourced. The revenues, profits, and cash grew more than the industry average, and the market value of its equity compounded, just like that.

Revenues grew 33.81% annually in the last five years:


And operating profits, 26.93%:


Symphony commands a pricing premium of about 10-12% over its competition.


Average price realization has increased from Rs.4,504 in per unit in 2010, to Rs.6,382 per unit in 2014.

Return on capital and return on equity have been very impressive. Given its asset-light business model, capital employed in the business is not large. From 2007-2014, Symphony has reinvested Rs.873.10 m in its operations, far less than its free cash flows.


There isn't any dilution in shareholding. Symphony knows it requires less cash than it generates from operations, and accordingly, it has revised its dividends payout policy to about 43%.


In 2009 and 2011, it had a significant investment in working capital; and in 2012, it had large savings from it. Symphony operates with cash-and-carry model on its retail sales (it does not give any credit), except about 30-90 days credit on the modern retail chains and e-commerce. There is no debt on its books. Free cash flows have been increasing.


Symphony's focus on marketing is evident from its spend on brand building. It spends close to 5% of its revenues on advertisements. In fact, earnings and return on capital need to be adjusted to reflect economic benefits resulting from advertisements, by capitalizing these costs.


No wonder, it's a surprise all through:

But what next? Can it sustain its growth and margins? Will it be able to withstand the competition? Will there be enough market for this so-called low-innovation, no-brainer product?
Mr. Bakeri and company supply us with their perspective: The market for cooling products (not fans, but air coolers and air conditioners) is about 246 m households in India. Even if the collective air cooler industry can carve away 1% of this 246 m household segment and then share it equally across the five largest manufacturers, we assure you that would still mean respectable revenue growth for Symphony over what it reported in 2014.
The total (including unbranded) number of air coolers sold in 2014 were 6 m units, currently a Rs.20 b market. The organized branded market is 20% (1.2 m units), but has been outgrowing the unorganized market. This is likely to continue in future, especially considering the GST rollout, which brings the unorganized market in the tax net. The management reckons that declining difference between the cost structure of the organized and unorganized market will enhance the value position of the organized market in the coming years.
A majority of air coolers sales are reported from Northern and Western India (60%); and Eastern (20%) and Southern (20%) markets are yet to be tapped.

June 2011 annual report highlights the advantages over air conditioners market:


Symphony has been increasing its foothold in the foreign markets as well. Currently, about 26% of revenues come from exports. Because of the varied demographic market it serves, the company does not have concentrated quarters for revenues penetration, anymore.


Through Impco, Symphony has targeted industrial cooling solutions market both in Americas and in India. More than 300 installations have been rolled out in India already.

Symphony wants to focus on shifting fan users to air cooler users:


The air conditioner market is about 3 m units, while organized air cooler market is about half of it. The management expects that while the total market for air coolers is expected to grow at 15-20% over the next 5-6 years, the organized market is expected to outpace that. It also considers that the untapped market for central air cooling solutions is large.


According to management, central air cooling solutions segment could earn revenues of Rs.1 b over the next few years.
Nevertheless, there are some bold statements made by the management. Sample this: We are economy-agnostic; when the economy does badly, we say, how does that matter? When people question our growth with, how much longer?, we smirk because they have seen nothing yet.
Today with market value of equity at Rs.79.57 b, its stock is trading at about 75 times its 2014 earnings. Sure, Symphony is about to close its year in June 2015 and report its latest annual performance. We don't have the consolidated numbers yet. Even if we accept that there is growth in the business, we are not in a position to justify that it is so much to warrant doubling of market value in less than a year.

Yet, I tried enough: With estimated revenues of Rs.22 b in the next 10 years (2024), without any significant deterioration in operating margins, Symphony would generate free cash flows to firm of Rs.16 b over the period. This compares to Rs.2.25 b of free cash flows to firm it generated over the last 8 years. Then comes the stable growth period, when we can restrict its return on capital, reinvestment, and growth to suit a mature business. I tried to come up with a discount rate that would justify the current value of Rs.2,270.90 per share; and it was 6.92%. That would be silly, I reckoned.

Then I checked the growth rate Symphony would have to achieve to give the rate of return that I would want from an equity investment; alas, the revenues in 2024 would have to be Rs.275 b. Well, I am usually very rigid in my stable period assumptions, yet, here I assumed that Symphony would be able to maintain fairly high operating margins; I would not change my growth and reinvestment estimates during the stable period, though.

I also used an earnings multiple that I thought would be reasonable (must say, I was much less conservative than usual), and what the heck, Symphony would need revenues of Rs.83.79 b in 2024, to give me my required rate of return.

Now I ask the market, for how long?

Thursday, June 18, 2015

there is no precision to valuation

I have written about valuation earlier. It is no secret that value of an asset is the present value of its future cash flows discounted at an appropriate rate. In other words, it is today's value of cash that can be taken out. 

If there are no cash flows, there can be no value, period. There goes the so-called-valuation of precious items such as gold, silver, or even collection items, for a toss. You cannot value them, you can only price them. 

Let's move to cash flow generating assets, in particular, stock of a business. The business will have cash flows until it is liquidated. A good business might have positive cash flows, and a bad one might have a stretch of negative cash flows. Yet, cash flows are what matter when we want to value the business.

Heck, both cash flows and discount rate to be used are difficult to estimate. For this reason, most of the analysts and investors use multiples to come up with pricing, and call it valuation. The expectations game and the timing game are routinely played in the market. 

When we have constraints on estimating cash flows and discount rate, it makes sense to look for alternative approaches to investing. I noted how private equity investors expect return on their investment. 

The more we think about valuation, the more we should accept the fact that no valuation is going to be perfect: The cash flows are going to be wrong; the discount rate is going to be wrong; and even more, the entire process is going to be colored by emotions; our greed, fear and envy at the point of valuation impact our estimates. It is hardly surprising that our valuation is not going to be right. 

So what do we do? We still need an approach to make money off the markets, and if we believe that often markets are inefficient, there is all the more reason to think about ways to deal with that. Of course, for an investor with no time and interest, buying index is the best approach, that boring, low risk investing.

For the investor who has both time and interest in equity analysis, it is exciting, yet, the constraints remain the same: estimating cash flows and discount rate. Assuming that he can play the waiting game to deal with estimating cash flows, he still has to find a way to come up with the discount rate.

Here, the private equity approach comes handy. The academia and most of the analysts restricted by the institutional imperative use the CAPM to calculate the discount rate. The value investing camp rubbishes it, but fails to lay down an approach that can be used consistently. They like to take a dig at the rest of the world, but often, do something similar implicitly. For instance, they also use different discount rates for different cash flows streams, just like the CAPM guys; the CAPM guys are more explicit in their calculation of the discount rate, while the other camp is more implicit. There are other silly things that value investors do, which I will deal with another day.

I have no right answer to deal with the discount rate. Nevertheless, it is important to note that value of a business changes when we change the discount rate, sometimes significantly. Therefore, it is wise to be realistic when an investor uses the discount rate.

If the discount rate represents our opportunity cost for postponing present consumption, retaining (or increasing) purchasing power, or even dealing with the uncertainty in the future, we need an appropriate return on our investment. Going back to basics, an investor should expect a rate higher than the government treasury, a rate higher than high quality debt instrument, and also a rate higher than the market rate.

If this is acceptable, we can come up with a way to accept the discount rate too. Here's how.

The value of a business with cash flows of 100 growing at 5% perpetually changes as we change our expected return. If its stock is trading at 1,500, at 10% expected return value is higher than price. The question to ask, however, is whether 10% return is acceptable. We could buy government treasury or a high quality bond for that return. If we buy at the current price, the expected return is 12%, is that adequate considering our opportunity costs? If the expected return is 15%, the price has to come down by 30% to 1,050; but wait, can't we get that return by just buying the index? I reckon, for a selective stock picking investor, the expected return cannot be lower than market returns. Therefore, he will have to ask for more than that. Let's start with 18%; for this return, the market price has to come down by 46% to 807.


In fact, this simple model can be extended to the standard DCF model, using cash flows and growth rate that are demonstrable for the business until it becomes mature, and after that using return on capital, growth rate, reinvestment, and cash flows that characterize the stable business.

Logically then, the investor would wait for the price to come to 807 or lower to provide adequate return to his investment. For any lower returns, he has alternative investments available. So that means the investor will have to happily come back to my favorite, the waiting game.

The concluding thoughts: The investor cannot come up with an accurate value of the business given the constraints on the precise discount rate. Rather than attempting to value, he should wait for the prices to reach to his level of expectations. The investor should not calculate the discount rate using the CAPM like the academia and institutional analysts, and he should rather not use an arbitrary discount rate like the value investing camp.

What he should do is wait for the price to fall - and there will be occasions considering efficiencies in the market - before he can buy any stock so that he will get adequate return on his investment.

What is the point in swinging routinely, just for the heck of it? Don't we have better things to do in life?

Tuesday, June 16, 2015

castrol's capital constraints

Castrol is in the business of manufacturing and marketing of lubricants, and is mainly operating in the automotive and industrial sectors in India. Automotive segment contributes over 85% of revenues and earnings. Its manufacturing plants are located in Patalganga, Paharpur and Silvassa. Currently, Castrol's exports are negligible. Lubricants are made by blending base oil with additives. Its main raw material is base oil, which is largely imported, thus the company is exposed to foreign exchange risk.

Castrol sells several products under its brand:  
Engine oil for cars: Castrol Edge, Castrol Magnatec, Castrol GTX
Specifically for Tata and Maruti cars: Castrol GTD, Castrol Maruti Genuine oils
Automatic transmission fluid for cars, trucks and buses: Castrol ATF Dex II
Engine oil for motorcycles and scooters: Castrol Power1, Castrol Activ, Castrol Go
Engine for trucks and buses: Castrol Vecton, Castrol CRB, Castrol Tection, Castrol RX
Antifreeze and coolants for trucks and buses: Castrol coolant
Manual transmission fluids for trucks and buses: Castrol Manual
Castrol also makes engine oildriveline fluid, and greases for off-road vehicles. 
As per the company's presentation, it is the largest lubricant player in India with the largest network of 380 distributors servicing over 105,000 retail dealers. Again as per the company's presentation, Castrol Activ, Castrol GTX, and Castrol CRB Plus are the largest selling engine oils in India.

Castrol India is owned by Castrol Limited (71%), which also has board representation. LIC owns 4.2%, and Aberdeen Global Indian Equity (Mauritius) Ltd owns 1.40% of shares in the company.

Its board comprises:


Three non-executive directors are nominated by the parent company, Castrol Limited, UK.

Management of Castrol comprises:


Remuneration to the management was Rs.41.40 m in 2014, approximately, 0.12% of revenues.

There were 494.56 m shares outstanding as of 31 March 2015.

The company pays approximately 2-2.50% of revenues as royalty to the parent company. In 2014, royalty amounted to Rs.730 m. In the last seven years, it has paid out Rs.4.76 b in royalties.

Castrol does not have any subsidiaries, and operates in India as a stand-alone entity.

In the last five years, revenues grew 7.91% annually, and in the last ten years, 9.98%.


Castrol had revenues of Rs.33.92 b in 2014, up by 6.69% over 2013. Previous two years growth has not been noteworthy (1.88% in 2013 and 4.66% in 2012) either.


Year-on-year, sales volumes have been falling. Clearly, the company is struggling to increase its revenues, although, there seems to be some pricing power. Castrol's products command about 20% premium over the competition on average. Price per litre has increased by 8.89% and 11.46% annually in the last five and ten years respectively outpacing revenue growth.


The aggressive pricing strategy by local as well as international competition, in an attempt to gain market share, and commoditization of products in the premium segments, has had an impact on the operating margins. Castrol has, however, demonstrated sustainable operating margins.


Return on capital is absurd with such little capital employed. Return on equity has been quite good, and should be much better in the coming years due to the capital reduction program.


There isn't much change in its earnings per share over the past five years, and this is without any dilution in shareholding.


Castrol is operating with a capital of only Rs.653.30 m compared to Rs.2,348.80 m in 2004, and the business has demonstrated that its current operations do not require much capital. Naturally, it has been generous in terms of dividends payout.


It looks like Castrol is facing severe competition in the market, is not able to increase its market share, sales volume, and revenues in any meaningful manner. Over the last seven years, it has not made any reinvestment in the business. Its savings from working capital and depreciation have more than compensated its whatever little capex program.

During 2014, Castrol returned half of its share capital, i.e. Rs.5 per share back to its shareholders under the capital reduction scheme amounting to Rs.2.47 b. Castrol had Rs.4.31 b of cash as of 31 December 2014.

Castrol does not need much capital is evident from its liberal dividends payout.


Castrol has been generating free cash flows to firm all through, which it has been returning back to its shareholders.

From 2004 to 2014, it generated free cash flows to firm of Rs.33.19 b, and paid out Rs.27.88 b as dividends.

Castrol and national oil companies have a market share of 55% (in terms of volumes), 20% is with other multinational companies, and 25% is with several local small competitors. These small players have been competing aggressively with lower prices and higher sales promotions to gain market share.

The management acknowledges that the industry has also witnessed a trend of some OEMs introducing lubricants under their own brand name, further impacting the competitive landscape.

As per the management: Lubricant volume consumption for the same rate of use decreases, while per unit cost and price realization increases. Therefore, other drivers remaining unchanged, the growth in demand for lubricants is expected to lag vehicle population growth rate in the foreseeable future.

Castrol spends significant amount on advertising; it has spent Rs.8.82 b in the last seven years. It is doing what is required in order to keep its brands strong.

Having heard the management, it is clear that Castrol is going to face challenges in increasing volume growth, and is dependent upon price increases to scale up revenues. It does not have any plan for increasing production capacities, and consequently, most of the free cash generated is promptly returned back to the shareholders. This is the correct thing to do for a manager if there aren't any investment opportunities, and there is no debt to repay.

Castrol has provided significant value to its long term shareholders. Its current market value of equity is Rs.211.94 b; its high was Rs.30.28 b in 2004. Annual return for the shareholders has been massive.


As it is the case, there are many stories for us to read, here are a few:
Castrol optimistic about lubricant market and growth;
India is a very big market for Shell;
Gulf Oil Lubricants India on a smooth drive;
Castrol's volumes are likely to grow 2-3% annually in the next few years;

In the coming years, Castrol should grow at a very modest rate, yet generate a fair amount of free cash flows, unless it does or witnesses something dramatic.

Based on a perpetual growth model, i.e. assuming that Castrol will be able to grow its current free cash flows perpetually, the current market price would be justified depending upon the market's choice of a combination of the expected return and perpetual growth rate.


In other words, the market is assuming that if the expected return is 10%, the perpetual growth rate of free cash flows would have to be 7.74% to justify the market price of Rs.432.10. If the expected return increases to 18%, free cash flows would have to grow at 15.74% perpetually.

If you want to buy the stock today, you have to be comfortable with the perpetual rate for the free cash flows to grow. Gotcha!

Monday, June 15, 2015

low risk investing

Consider this: Nifty was at 1480.45 on 30 December 1999. It was trading at a PE multiple of 24.09 and PB multiple of 4.30. The market was yielding dividends of 1.02%. Of course, it was trading at a very high price compared to value. In fact, it was looking at a bubble which was about to break; the market was at such a peak price that the implied equity risk premium was the lowest. Any sensible investor would not buy into these levels. 

And bubble break it was. By July 2001, Nifty was trading at 1053.40 with a PE multiple of 14.92 and PB multiple of 2.33. Frankly, for an investor there was value everywhere until 2003. The opportunity to make money was clearly visible. 

In October 2003, Nifty was trading back at December 1999 levels. That means, for someone who bought at the beginning of 2000 and held through until 2003, there was zilch. Just why would anyone buy the market at such high prices? It does not make any sense, does it? 

Well, it turns out that considering the opportunity costs it did make sense to buy the market at that time provided the investor held it through today. On 12 June 2015, Nifty closed at 7982.90. The annual return for the investor would have been close to 12%. This return is actually post-tax since long term capital gains are not taxed in India. I don't think any other alternative investment would have returned better than this. 

The moral of this story is that time in the market is more important than timing the market. Equity investment is actually a low risk, high return game, as opposed to the more conventional high risk, high return.  

Even buying in a high-priced market would have yielded superior returns if the buyer had the qualities to admit first and then correct the mistake by letting the time take its course.

If the investor does not understand or has no interest in the game, it is much better to keep buying the index over a long period of time, rather than believing that he can beat the market. If he had done just that, i.e. bought the index every month from January 2000, the annual return by now would have been close to 15%, rather than 12%. This return should be more than adequate for the time and effort put in. 

If the investor wanted better returns there was another way: A more sensible investor could have, and should have, bought the market in 2003 and earned close to 19% after-tax returns. That's the way this game should actually be played.

Just imagine, how easy it is to make money provided one behaves in a manner that is required; emotions have no place in this game. The markets supply enough opportunities for us to act, but these are not available on a routine basis. We should have the patience to wait for the right time before we strike. Alas, not many are equipped to do this simple, yet powerful act.

Eventually, market prices follow fundamentals of the business:


Of course, nothing like picking stocks: Individual stocks give much better returns if the investor is ready to put in efforts in analyzing the business, its price and value. Equities are actually low risk, high return investments. Unfortunately, not many understand this, and more evidently, not many have the right behavior that is required to play this game.

If investing was high risk, I would avoid it. Thank heavens, it is not, but speculating is.

Tuesday, June 9, 2015

did you buy nestle in 2004

Nestle has had a phenomenal success in India in the last many years is something everyone knows. But just how phenomenal for the shareholder?


It depends upon at what price you bought, obviously. If you bought at 2004 high price the annual return would be 18.54% by now; and if it was 2004 low price the return would be 22.19%. The market return during the period is 12.72%. 

I tried to go back to 2004 and find out the intrinsic value of Nestle stock at that time, just to check if there was any indication of a screaming buy. Then I compared my estimated numbers to the actual numbers. This is what I saw:

Actual revenues in 2014 were Rs.98.55 b compared to my estimate of Rs.68.82 b.


Usually, we estimate that operating margins would be linear across time; however, in reality it is never so.


I missed Rs.15.57 b capex that Nestle spent in 2011 on expansion. 


Again, linearity in estimation never seems to vanish; actual return on capital has been impressive.


Finally, I estimated that Nestle would generate free cash flows to firm of Rs.44.44 b during 2005-2014. However, it actually generated Rs.56 b.


From 2015, I assumed that Nestle would be in a stable growth period, and accordingly its growth rate, return on capital and reinvestment rate were adjusted. Nestle stock had a high of Rs.720 in 2004, and EPS was Rs.26.13, implying a PE multiple of 27.56. My valuation suggested a buy at its high price, but not a screaming one. Nestle also had a low of Rs.500 in 2014.

Nevertheless, when I tried to value Nestle in 2004 assuming that I had the knowledge of its actual free cash flows (Rs.56 b), the stock became a screaming buy.

To put it differently, at PE multiple of 27.56 Nestle was a buy in 2004. Today, Nestle is immersed in an interesting tangle where its future looks bleak, and its stock is trading at a PE multiple of 45.

Will you buy that stock now? Remember what I said earlier.

Saturday, June 6, 2015

do you want to jump the gun on nestle

As I look for the stories currently developing on Nestle in India, I see this:


Well, as you can see there are too many stories to tell. There is a problem with Maggi now is an understatement. Perceptions have the power to cause much stronger impact, and consequently, can inflict real damages. They can take to very different levels irrespective of the facts. 

The debate should not be about whether the product is bad for health; of course, all packaged food items are bad for health. Colas are bad too. The quicker we deal with these issues, the better it is. The question is, will we ever?

People have been eating bad food for a long time. Because history has taught us something - they will forever remain the same - how can an investor, current or potential, in Nestle think now? Will consumers be smarter, wiser? 

Our favorite game has just begun, though: Can we buy Nestle stock now that it has fallen close to 15% from its previous levels? On 19 May 2015, Nestle closed at Rs.7,007.75 when this story broke out. Now it is selling at Rs.6,000 levels:


While we see a buying opportunity there are a number of questions remain to be asked.

Before the story became public, the stock was trading at a very high earnings multiple. While earnings multiple is just a proxy, the fact was that the stock was priced very high compared to its future earning power. In other words, at that price the present value of future cash flows of the business was much lower.

What has changed now is that the price has come down a bit, and might come down much more if the current perceptions continue. If we have to make an investment decision now, naturally we have to take a fresh call on the gap between price and value.

The question to ask is whether the long term earning power of Nestle has reduced significantly due to the dent on its powerful brand, or whether it is just a temporary problem that can be and will be fixed in due course. Maggie forms a significant portion of Nestle's revenues, and has been a very profitable product. The chances of diminishing brand power rubbing off on other packaged food items of Nestle cannot be ruled out. But then, it might not either.

As we gather our thoughts, we should ask what is going to be the impact on the following in the coming years?


And consequently on this?


If the developing story is not going to be good, as earnings go down, and business prospects deteriorate, so will the market price eventually. The gap between the current market price and the intrinsic value of the stock then should be very high. On the other hand, if the story is going to be as it was in Nestle's long past, well, we have an operation to make money.

Where do we stand now? We don't have crystal balls, and it is not easy to make those predictions. The answer is to play the wait and watch game. With the passage of time we will get to more stories, and hopefully, we should be in a position to take a decision.

Until then though, just don't jump the gun.