Pages

Showing posts with label valuation. Show all posts

Monday, April 29, 2019

axis and yes bank q4

Both Axis bank and Yes bank reported their financial year results, and here's the story. Axis reported Rs.50 b profits for the year, and Yes had Rs.17 b profits. 

Yes also had losses of Rs.15 b for the latest quarter weighing in heavy provisions. While people are fretting over those losses, they don't get that when an investment turns sour, it just can't be called sweet; taste it to know it. Postponing provisioning for non-performing assets doesn't make sense even when the regulator or laws allow it; that will be stupid. On that front, Yes bank has probably done the right thing. 

Yes bank's book value is Rs.116 per share, while that of Axis is Rs.263 per share. With these numbers, their stocks are trading 2x and 2.8x respectively. But that is not the way to look at it. They have more NPAs, including stressed assets, that are not yet provided for. Including them in book value will inflate equity. Adjusting for full provisions on estimated NPAs, the stocks are trading 2.68x (Yes) and 3.43x (Axis).

Both banks have decent regulatory capital ratios: Axis (12.7%) and Yes (11.3%) in Tier 1 capital. Loan book is growing for both banks. Axis has better CASA (44%) compared to Yes (33%). Axis also has lower cost of funds (5.69) and Yes (6.5%), and slightly better net interest margins (3.44%) compared to Yes (3.2%).

Yet considering the current stock price, for a return of 13-15% in the next 3 years, Axis will have to grow 20% and Yes, 15%. Of course there will be people who will shoot for Axis in terms of higher growth and better book. At its current price though, Yes bank could give a return of 8% with a 10% growth rate. This is based on the reported gross NPAs and stressed assets; any hidden NPAs should bring the book equity and returns lower.

There is also a good chance that the Yes bank stock will be hit hard in the next trading sessions, and that should give opportunities for better returns. Axis bank is also likely to do well, but its stock price as of now is a little on the higher side. 

Monday, March 18, 2019

lyft ipo

Lyft is coming up with an IPO at an expected valuation of $20 b to $25 b. Its previous private valuation was $15 b in June 2018. Now that it is coming out with a $2 b IPO, the market is going frenzy.

Here are the investors seeking a valuation as high as possible. 


And why not, when there are buyers at the price? But then pricing is a game played by the private equity and venture capitalists, and for the right reasons: They want to cash out. That's their compensation for taking risk.

What about investors who like looking at the business and numbers? I haven't got a story for Lyft, for it is beyond my imagination how far it can or cannot go. It could do very well, or it could falter. I am not sure. That's not my game. But I can lay down the numbers. 

Lyft had revenues of $343 m in 2016. They became $1 b in 2017, and $2.1 b in 2018. That's a massive increase. But the business incurred losses in operations: $693 m, $708 m, and $978 m. Markets say it is the nature of the business like any other high growth start-up. 

The business is not using much of capital. It had $3 b in cash, marketable securities, and restricted cash as of December 2018. But it will need a lot of capital going forward. Because it is losing cash every year: It has been losing over $500 m each year (2016 to 2018). For 2018, this is despite $625 m positive cash flows from changes in non-cash working capital.

We haven't got a firm hold of numbers since operating profits and earnings per share are both negative. It has had low capital spending: $71 m for 2018, and much lower during the previous two years. It acquired Bikeshare Holdings (Motivate) for $250 m, and spent $300 m on research and $352 m on advertising in 2018. That's a significant portion of revenues. There are no free cash flows yet. 

Where do we go? Easy, look at the pricing multiples. 

If we price Lyft based upon revenues: For $20 b valuation, it will be 10 times revenues. That will come down to 8x if revenues increase by 25% next year, or 6.67x if they increase by 50%, and so forth. Pricing always gets interesting.


If we choose riders: The price per rider will be $667 for the $20 b Lyft. The catch is Lyft had 18.6 m active riders. The the price per active rider will be $1,075.


How about pricing based upon bookings? 


Lyft at $20 b = 2.5 times its 2018 bookings. Cool.

There were 241.614 m shares outstanding after conversion of preferred shares as of December 2018. If we round off and consider 250 m shares, the expected IPO price will be $80 per share to get that $20 b value.

Then you can juggle, and include the options (6.828 m) and RSU (31.605 m) outstanding, and come up with 280 m shares; and the price per share will be about $70. If you include $2 b coming from IPO, the price will be $64 per share, with an additional 31 m shares being issued and totaling 311 m shares.

Lyft is a good business. But the question is at what price. That's the conundrum we face with every technology growth business, don't we?

Monday, March 11, 2019

coke and pepsi

Coke or Pepsi, which is better? Both are lousy as consumer products. But I mean, which is better as a stock? Coke is worth $191 b, and Pepsi, $161 b. The Coke stock implies nearly 30 times its earnings, the Pepsi stock, 13 times. Why should Coke trade at a higher multiple than Pepsi? Is Coke growing better than Pepsi? Which business has a better return on capital and return on equity? Or is there a bias?

Coke has a better operating margin (20%) compared to Pepsi (16%). But I don't care much about operating margin. What I do care is return on capital. Pretax return on capital for Coke is 25%, and that of Pepsi is 30%. These are long term averages. The most recent values are 36% for both Coke and Pepsi. 

And I care as much about sustainable growth rate. The 5-year average growth rate in revenues for Coke is negative 7.43%, and the 10-year average is 0%. It had revenues of $31 b in 2008, and they were $31 b in 2018. For Pepsi, the 5-year average growth rate in revenues is 0%, and the 10-year average is 4%. It had revenues of $66 b in 2013, and they were $64 b in 2018. Pepsi's revenues grew 1.79% in 2018, and Coke's fell 10%. So much for growth rates. 

They have products that are not healthful, and there is no growth in revenues. Do we really want to talk further? Both companies spend considerable amount on advertising. But it seems that Coke is more desperate, for its average ad spending is 10% of its revenues compared to Pepsi's 4%. Yeah, Pepsi has more diversified products. 

When we capitalize advertising costs, the pretax return on capital changes to 27% for Coke and 31% for Pepsi for 2018. I am using pretax return on capital because of strange things that have happened in tax rates recently. 

Both companies are mature businesses and payout significant dividends. The 5-year average growth rate for Coke dividends is 6% and 8% for Pepsi. The 10-year average is 7% for both. 

Let's look at free cash flows. Pepsi had $6.75 b pretax cash flows for 2018, and Coke had $6.1 b. The 5-year average for Pepsi is $9 b and $6.79 b for Coke. For both companies, free cash flows have not been growing. In fact, they are falling. 

So again, why should Coke be priced higher than Pepsi? Is it because a prominent investor holds it and backs it? That's appears to be a stupid idea. But then we are not dealing with rational people.

I will start with $6 b as aftertax free cash flows for Coke and $6.5 b for Pepsi. Never mind these are much higher for Coke compared to its historical numbers. With these assumptions and a growth rate of 5% leading to a cap on the growth rate after a decade, we get similar values ($85 b) for both at an expected rate of 10%. 

Based upon free cash flows at least, the market pricing for both companies appears to be on the higher side. But my point is that Coke should not be priced higher but lower than Pepsi. And this has not happened for a long time. In fact, most of the time, the yearly low market value of Coke has been higher than the yearly high market value of Pepsi. That is bias, Coke being accepted as a more prestigious brand. But then who cares for the brand when the cash flows behind it do not justify the price? 

I am no fan of either, for I don't like their products. But it is time that the market realizes the potential of these companies, and prices them accordingly. 

Thursday, March 7, 2019

amazon march 2019

I have written about Amazon before, and as I have admired the company as a disruptive business, I have never been impressed with its lofty valuations. Value of a business, after all, is the sum of its cash flows discounted at an appropriate rate. It is not anything else. Markets may have been overwhelmed by Amazon, but at the end of it, its value is driven by its cash flows. 

In 2008, Amazon had free cash flows of $773 m. In 2012, they were negative $640 m due to higher capex. In 2015 and 2016, Amazon's free cash flows were over $4.5 b. Just when we thought the business will generate consistent cash flows, we had a surprise. In 2017, because of $13 b Whole Foods acquisition, cash flows were negative $11 b. For 2018, it had $9.8 b of free cash flows. They have been quite erratic as they usually are for a growing business. We have a conundrum: What are the sustainable free cash flows for Amazon? Last 3-year average is $1.1 b; 5-year average is $1.5 b. If we ignore 2017 as an exception, the 3-year average is $6.5 b. Heck, we at least need a starting point. 

I am not much of a story person. I need the business to tell me the story rather than me weaving one. The total market value of Amazon's equity is $820 b. Let's assume that investor's expected rate of return is 10%. I don't want that cost of equity shit. If I want 7% return, I will go to the S&P-500. With that out of the way, we need two more variables. One is the free cash flows, and the other is its growth rate. 

I will be an Amazon bull - which I am not - just for fun. Let's start with the beginning free cash flows of $9.8 b. Let's keep the growth rate high at 25% over each of the next 5 years, which means they will be about $30 b in year 5. I have estimated free cash flows aggregating to be $325 b over the next 10 years. For the record, they totaled $12 b in the last decade. Keeping the stable growth rate at 2.5% after year 10, I have put a break on optimism. Amazon had cash equivalents of $41 b and book debt of $32 b as of December 2018. But, it also had lease debt of $23 b which are off balance sheet because of some funny accounting rules. When I use these numbers as valuation input, I get a value of Amazon's equity much lower than its current market price. That's something to note because I have used high free cash flows as a starting point along with high growth rates.

May be one thing I missed was using high perpetual growth rate. Here's is the thing: If we used 6.5% as growth rate in free cash flows as perpetual, we get to its current market value of $820 b. The present value of Amazon's free cash flows at this growth rate is only 20% of its total value. The bulk of its value is coming from the stable growth (perpetual) period. If we start with lower cash flows as base, we will have lower value. Obviously if we keep the growth rates lower, we have lower value. 

I am amazed that Amazon continues to be priced by the market at such lofty expectations. You cannot buy an asset for its future price. The time value of money will tell you that. And yet...

Of course, when we do adjustments for lease debt, advertising costs, and technology costs, Amazon's operating margins, return on capital, and return on equity look good. But you need cash flows to value its business, and they aren't good enough at its current market price.

In March 2013, I thought long term thinking was doing good for Amazon (market value $120 b). But in February 2014, I asked, how long is long term ($160 b). In May 2015, the question was, when's the money ($200 b). In September 2015, I noted the price and value mismatch ($235 b). In July 2016, I compared Amazon with Berkshire Hathaway, and continued to ask, where's the cash ($347 b). In March 2017, I noted that when Amazon's market value hits $600 b Bezos will be the first $100 b person ($427 b). By August 2017, I talked about the hype ($474 b). In October 2017, I looked at Amazon's q3 numbers ($525 b). In February 2018, Amazon was worth $695 b, and Bezos $100 b. In August 2018, Amazon was worth $908 b as I compared it with Apple. 

Every time I try to value Amazon, I am far from meeting its market price, and I have been wrong in expecting its price to fall. Now Amazon is worth $820 b, and I say the same thing: that Amazon is expensive compared to its cash flows.

Amazon had revenues of $232 b for 2018, an increase of 30% over 2017. North America accounts for 60% of it, and Amazon Web Services, 11%. There was a marked improvement in operating profits for the North American (retail) segment though.


Nevertheless, AWS accounts for much of the operating profits, and the international segment continues to suffer operating losses. AWS has been very profitable and is growing faster than retail. As such, it would be better to look at AWS as a separate business, and value it independently.

There were 2 acquisitions in 2018: Ring for $839 m and PillPack for $753 m. Technology and content costs were $28 b. Amazon is still a growth company, and for that it needs a lot of capital. The key is how much free cash flows it will be able to generate in the next decade. It is a disruptive business, it is a fantastic business. But then it is also richly priced; and it has always been like that.

Thursday, January 10, 2019

indusind bank q3

IndusInd Bank has moved down more than 2% as I write this post subsequent to its December quarter reports. While I don't care much about the day-to-day market prices, let's us have a look at how the bank has performed during the quarter, and how I feel about the stock. 

With 602 m shares outstanding and the stock quoting at Rs.1601.75 as of yesterday, the market cap of the bank is Rs.964 b. It earned Rs.9.85 b during the quarter. The net interest margin of 3.83% has not changed much compared to the previous quarter; but it is way down from the March 2018 margin of 3.99%. The casa ratio of 44% has remained steady all through the quarters. The cost to income of 43.65% has improved; in March 2018, it was 45.65%. But the cost of funds has gone up to 5.81% from March 2018 (5.03%). 

The true test of banking business is its loan book, its growth rate, and quality of that book. IndusInd bank's advances have increased more than 19% from March 2018. That implies an annual growth rate of 25%. The bank had gross npa of 1.14% and net npa of 0.59% which is remarkable for the private lender considering the current circumstances. In fact, the net npa (percent) has remained quite steady during the last four quarters. Restructured advances were Rs.1.86 b as of December 2018. 

The book value per share stood at Rs.438.48. But that is not the correct measure of the bank's equity. After adjusting for all stressed assets, the book value is Rs.418.30 per share. Now to price the stock, we can pick a multiple; and the expected rate of return for the investor will depend upon that multiple. 

Let's keep the investment period of 3 years and annual loan growth rate of 20%. At a price-book multiple of 2, investment return over the 3-year period is going to be negative. The bank probably deserves a better rating considering its growth rate and quality of assets. At 2.50x, the expected rate of return is a little over 4% which is not much. At 3.5 times book, the expected rate of return is more than 16%, and at 4x, it is more than 21%. We can play with the multiple, but if we consider 3 times book as fair, the investors stand to make about 11% on the stock over a period of 3 years. Whether 11% is good or bad depends upon the individual investor's own opportunity costs. 

For any bank, capital is key to its growth expectations. Any increase in advances will have to be matched by increase in equity capital. IndusInd bank's Tier 1 capital is quite fine at 13.78%. A growth rate of 20% should not be too difficult for the bank considering the superior quality of its assets. The bank's return of assets and return on equity are pretty decent too. 

IndusInd is a well managed bank; but then to buy at its current price, the expected rate of return will have to be modest.

Tuesday, September 4, 2018

how much can you make on nestle

Nestle India is worth Rs.1,060 b now. Based upon its reported earnings of 2017, never mind the subsequent nine months, of Rs.12 b, it works out to a pe multiple of over 85. It has never been quoted that high at least in the last decade. Sorry, it did once in 2015 when it was priced at a high pe of 128, and a low pe of 94 during the year. Even from a market price of Rs.723 b (high) in 2015, the annual market return to date is more than 15%. And it has effectively doubled in market value from its low price of Rs.530 b in 2015. 

Of course there was an anomaly because 2015 was an exceptional year for Nestle. There was a charge of Rs.5 b to its income statement due to the Maggi episode. If we remove this as one-off, the net earnings for 2015 would be Rs.10 b, and the high and low pe multiples fall to 68 and 50 respectively. That means, investors who bought in 2015 and sold now made money thus: buy at pe 68 or 50 and sell at 85 after a 15% rise in Nestle's earnings. Cool deal. But the catch is that if the pe multiple now is same as it was in 2015, i.e. 68, the returns would be paltry if bought at 68 times, and more than 15% if bought at 50 times.

I call this hope-based investing. When we rely entirely upon the multiple expansion rather than earnings and cash flows expansion, we need to sit and pray. 

Let's talk about good part of the story first. In 2007, Nestle's market cap was Rs.160 b (high) and Rs.84 b (low), and earnings were Rs.4 b. In 2012, it was Rs.484 b and Rs.378 b, and earnings were Rs.10 b. Investors benefited twice: earnings more than doubled during the period; and the pe multiples expanded from 38 (high) and 20 (low) to 45 (high) and 35 (low).

Now look at what happened during the subsequent five years. Earnings increased from Rs.10 b (2012) to Rs.12 b (2017); that is an annual increase of 2.79%. But the market value of equity more than doubled from Rs.484 b to Rs.1,060 b now. Nestle distributed about Rs.30 b in dividends in the past five years. 

Revenue growth has been 3.73% (5-year annualized) and 11% (10-year period). Earnings per share growth has been 2.79% and 11.47%. 

Let's make a bull-case scenario for Nestle. Let's assume that eps and dividends will increase at 12% per annum over the next 5 years; then eps would be Rs.224 per share in 2022. Dividends per share in 2017 was Rs.86. At the current price of Rs.11,277 per share, investors will lose close to 12% annually if we price the business at a pe multiple of 25 in 2022. There has to be some premium to the business, after all it is Nestle. Let's keep going. Even at the multiple of 45, investors will lose 1.20% annually over the 5-year period. At 50x, they will make less than 1%. At 60x, the investment returns will be less than 5%. Even at 80 times 2022 earnings, the returns will be 10.50%; the market index should be able to give that probably. If the expected return is say, 12%, the business should be priced more than 85 times earnings. 

Nestle's operating margins have been 17%. It also enjoys a very high return on equity and return on capital. The business does not require a lot of capital to operate. There has been no dilution in equity: 96.415 m shares have remained constant for a long time. Yet there is a moral in its story: A great business isn't always a great buy. There is a price for everything. Price is what you pay, value is what you get. 

Nestle has been generating solid free cash flows; for 2017, they were Rs.17 b. Nestle has not spent big on its capex other than in 2011 and 2012 for plant expansion. It is safe to assume that Nestle has the capability to generate average fcff of Rs.15 b annually. Although the growth rates in the past have been higher (5-year 20%; 10-year 17%), let's assume that fcff will grow at 12% over the next 5 years. If the expected returns are 12%, Nestle will have to be priced 70 times its 2022 fcff to get the present value of the 5-year cash flows equal its current market price.

Is it possible to earn decent returns from Nestle? Of course it is possible. But for that, investors will have to say prayers every day during their investment period: Oh, Lord, keep the pe up, and up. Is Nestle an exception? Of course not, there are lots of fantastic businesses priced egregiously by the market. Was it a buy in 2004? Heck yes.

Monday, September 3, 2018

buffett's peekaboo with technology

Warren Buffett has always said that he does not understand technology, and that's why he does not invest in that business. More famously he has mentioned that if anyone puts a value to an internet company, he would flunk. Well, times change, don't they? 

Buffett has invested in Intel and IBM in the past. And now he is too enthusiastic about Apple. Recently, Berkshire Hathaway bought a 3.5% ownership in the Indian technology company Paytm for $350 m. He had his standard response: he was not involved. There was a similar response when the company first purchased Apple shares. May be Buffett is slightly embarrassed to have backed out of his own cooking. After all, he is human too. In fact it is time, the world acknowledges that he is all too human. 

Buffett's justification these days for buying Apple is that iPhone as a product is sticky, and therefore it is quite underpriced. He never realized Microsoft's windows and office have been the stickiest for a long time, and he could not figure this out despite Bill Gates being his close buddy. He said in the past that he does not understand technology, therefore Microsoft. I don't see any change in facts in the past, now, and the future regarding the internet and technology businesses. Even Keynes would have noted that no facts changed, and therefore, there was no need to change mind. Yet, Buffett did. It is always difficult to predict the future of technology. You can't even do it with a broad brush. If he is playing peekaboo, well, we got him.

I reckon the real reason Buffett did not buy Microsoft in the past, and is buying into technology now is this: Earlier he had plenty of other undervalued businesses to buy, and there was no need to look at the technology firms. His cash was fully allocated. Technology stocks were for the dumb. Today the story is different. There aren't too many businesses he can buy considering the size of his capital. This is troubling him, and he is under pressure to stand up to his reputation. He doesn't want to distribute cash. How can he continue to earn excess returns? Voila, let's enter the uncharted territory: the technology, and let's make a validating story. Suddenly the technology stocks are for the smart. 

I have seen different versions of Buffett over the years. He is a very smart man is indeed an understatement. His investment records show what he is capable of. But if he feels that he can tell a story that people will soon forget to hear a different version of it, he is mistaken. I have been his admirer, no doubts about it. But I know what to pick, and what not. He has been making and unwinding stories in the past at least on four occasions: In 1955 when he wanted to retire at 25. In 1969 when he closed the partnerships saying stocks were too expensive, and sighted personal goals as incentives. Immediately thereafter when he took control over Berkshire Hathaway and made it into an investment holding company. And the fourth time he made his story believable was when he started buying technology companies. Oh yeah, he has also been advertising for soda and sugar; people who completely surrender to this thoughts believe that coke is actually good for health. When you are a shareholder of coke, you will find incentives to promote it. Well, to each his own as they say. 

As per this report, Paytm had revenues of Rs.8.28 b (2017) compared to Rs.5.97 b (2016), and incurred losses of about Rs.12 b in each of the years before exceptional items. As a technology firm operating in digital payments and retail business, it will continue have heavy expenditure on research, technology, and advertising. It also has a solid backing from Softbank and Alibaba. When it raised $1.5 b from Softbank in May 2017, Paytm had an implied valuation of $7 b. Now Berkshire's investment puts a value of $10 b for the firm. 

Paytm was founded by a smart person, and probably has the ingredients to scale up, and do well. It has also got the funding available from the global investors. But how much the firm is worth as of now, or how much it will be in the next decade or so is anybody's guess. Should we say, Buffett flunked his own test by implying a value on the technology business?

Wednesday, August 22, 2018

amazon and apple

Amazon is worth $908 b now, and Apple, $1 t. I am not sure anyone had predicted this five or ten years before. What we should be asking now is whether it is market hype and exuberance, or has any fundamental reasoning behind it.

Value of a cash flow producing asset is the present value of its lifetime cash flows. It is very difficult to estimate how much free cash flows a business will generate during its existence. A business itself changes from its early stage as a newly incorporated, later as a high growth firm, then facing lower growth, and finally as a matured business. These changes take place due to a variety of reasons, first being the nature of business it is operating. A high tech firm will have tremendous challenges for its existence early in life. The technological change is fast-paced. Every business will have to face the macro economic factors and competition. A high profit business will attract competition. Competition will force bring down excess returns. Often, it is the quality of management that will define the course of a business. Sometimes even a poor quality business is steered by an able management, although economics of the business tend to prevail in the long run.

Market price of a publicly traded business is determined by the market forces: demand and supply. Yet, demand will be higher for a high quality business with demonstrated metrics. The market price of a good business is usually higher than that of a bad business. If for instance, the revenues, operating profits, and earnings growth are higher than its competition, the firm will be priced higher. Return on capital and equity tell us how well the capital is being employed in the business. Earnings per share are indicative of how shareholders are rewarded. The higher the growth in eps, the higher the prospects of the business. 

Free cash flows generated by the firm are key to the quality of business. As noted earlier, the value of a firm is the present value of its cash flows. If we cannot estimate perpetual cash flows, at least past cash flows should be able to give us some idea about what they would look like in the next five or ten years. So there must be something to Amazon and Apple to have been priced by the market at trillion dollar levels. Let's find out their past. 

amazon
Amazon had negative free cash flows for 2017. Its operating earnings were $4 b, but Amazon spends huge amounts on research and technology, which are sort of investments for future growth. However these are charged to the income statement when incurred. Similarly it spends on advertising and sales promotions, which tend to benefit the firm over the years. Amazon also has a fair amount of non-cancelable operating leases which operate like debt, but are kept off books. When we make adjustments to the income statement for these costs, we get operating earnings of almost $16 b. Suddenly we find Amazon's operating margins (9%) and return capital (28%) at pretty decent levels. In addition, the advantage Amazon is getting by charging off these costs is that its tax liability becomes lower. 

However, they do not affect cash flows since these are only book adjustments. Amazon's acquisition of Whole Foods for $13 b along with its reinvestment requirements meant negative pretax cash flows of $10 b for 2017. Let's not penalize it because of one year. If we take a look at its previous ten years, we get a cumulative pretax free cash flows to firm of $20 b, or $2 b per year average. Make it previous five years, and we get $2.5 b average. If there was no acquisition in 2017, its pretax fcff would have been $3.5 b for the year. If we deduct its $10 b negative fcff of 2017 from the prior decade's total of $20 b, Amazon as a business has actually had an aggregate (2007-2017) pretax fcff of $10 b. With an effective tax rate of say, 25%, the fcff would be a total of $7.5 b during the past eleven years. 

Yet the market value of Amazon's equity has increased from $42 b (high) and $ 15 b (low) in 2007 to $908 b now. Now to justify its market value, its true cash flow generating ability should be significantly higher than what it is now. Heck, we can't even take its highest fcff so far (2016) of $4.8 b aftertax, for that would mean paying 188 times. Even if we assume 25 times is a fair multiple, market's assessment of Amazon's free cash flows ability will be $36 b. How can Amazon generate $36 b of free cash flows to firm? Alternatively, market must be assuming significantly higher fcff coming in the next decade. That will be possible if Amazon's operating earnings go up, and capital spendings go down. In 2017, its capital spending was $12 b, and the five-year average was $6.3 b.

If we start with $6 b fcff, and project it go grow at 25% annually during the next decade, they will be $55 b in 2027. This is the idea: Revenues $933 b, operating margin 9%, ebit $84 b, tax rate 25%, and $8 b reinvestment will get fcff of $55 b. If we price 2027 fcff at 25 times, and calculate the present value of all cash flows at an expected return of 10%, we will have a value of $632 b for Amazon. But it is worth $908 b now, which means market has different expectations: either the cash flows or fcff multiple will have to be higher. Or perhaps the expected rate of return should change, after all ten year treasuries are currently yielding only 2.823%. Amazon is a high growth business, and growth needs reinvestment, which lowers free cash flows. Isn't the game a bit tricky?

apple
Apple had pretax fcff of $52 b in 2017, and $82 b in 2015. In the last eleven years, it generated fcff of $424 b pretax. With a tax rate of 25%, close to what it has been paying, free cash flows will be over $300 b. Compare that with less than $10 b for Amazon. If we take $60 b pretax, Apple can generate $45 b fcff at least in the near future. Of course, the growth rate for Apple is much lower than that of Amazon's. That is one reason Apple's reinvestment requirements are lower, unless of course, its aspirations for i-Car, et al are going to come alive.

If we start with $45 b fcff, and project it go grow at 7% annually during the next decade, they will be $88 b in 2027. If we price 2027 fcff at 15 times, and calculate the present value of all cash flows at an expected return of 10%, we will have a value of $900 b for Apple's operating business. With net cash of $150 b, we have the market price of $1 t for its equity. The key risk for Apple is its expected growth rate. How long can iPhones shield it?

market
Different cash flows, different growth rates, different set of risks, and yet both Amazon and Apple are priced similar. The markets have reasons that reason cannot understand.

Friday, August 3, 2018

reliable valuation is a farce

Predicting the future is a waste of time
Someone said he was not good at prediction, especially the future. Well it applies to everyone, but not many accept it. That is why soothsayers and fortunetellers flourish. If there is demand, supply is automatic and natural. Nevertheless, investing in stocks requires knowing the future. We are talking about investors, not speculators and traders. Since a stock represents its underlying business, knowing the value of that business before making investments is imperative. 

Intrinsic value of a business
The value of a business is essentially the present value of all of its future cash flows using an appropriate discount rate. That may sound profound because it is. If it were straightforward, a worksheet would make people rich. All you require as input data are the cash flows until liquidation of the business and a discount rate to bring them to the present value. 

To make life a little simpler, we break down the lifespan of the business in two parts: One, a selected period comprising the number of years we expect the business to grow and to be able to estimate its cash flows, and Two, the stable period representing the rest of the lifespan. The common periods being used are: 10 years of business growth, and then a stable-growth period. Now we need inputs relating to the growth rates over 10 years and then a stable growth rate. The whole exercise involves estimating revenues, operating margins, and reinvestment. It requires estimating debt, including off-balance sheet. We may even have to estimate possible equity dilutions, and this can get complicated by the grant of stock options. Any claims against the business from the non-equity holders will have to be considered as well. There are more. 

Even when we want to keep things simple, we require at least a few estimates to arrive at the free cash flows: 1) The expected growth rate in revenues for the next 10 years; 2) The expected operating margins, and therefore operating profits over the next 10 years; 3) The expected reinvestment required to sustain the expected growth; 4) A stable growth rate assuming that the business will grow at a constant rate perpetually; 5) The stable period operating margins, profits, and reinvestment. 

The past growth rates and near-future prospects usually are a guide for estimating the future growth rates and operating margins. A cap on the business growth considering the whole economy is helpful in estimating the stable period growth. The internal consistency in our calculations helps us estimate the reinvestment required. Yet, these are estimates, and all estimates miss actual numbers reported by the business. Analysts then blame the managers for not meeting their estimates; and that calls for an ugh. Investors are left either amused or let down by their own estimates turning turkeys. 

It's a farce
I have been valuing businesses for a long time, and I know what it means to use a discounted cash flow approach to value a stock. But then I also know its demerits. When every single estimate used is going to miss the actual, is there a point in doing the whole calculation? And what's this stable-period business business? For a high-growth business, like Amazon, most of the value comes from the stable period, which may not be a true reflection of its forthcoming proceedings. We falter when we use a constant growth period after say, 10 years and the business moves on to grow at different rates over say, the subsequent 10-year period. For a mature business, the other way around is true, where most of the value will be front loaded, and the perpetual-growth value will be a small portion of it. But who knows when businesses such as Maruti Suzuki, Bharti Airtel, and Kotak bank, for instance, will become mature? We cannot use say, 4% perpetual growth rate after 10 years, if they can grow significantly higher in the 11-to-20 year period. Die-hard fans of DCF claim that the present value of the second decade cash flow will not be much to impact the total intrinsic value of the business. They are wrong because it will, if the growth rates are significantly different. They also advice using a second growth period, say the second decade, if required. Again as someone said, is there a perverse human behavior that likes to make simple things complicated?

Analysts and investors dealing with the multiples such as earnings, book, and revenues are cheating themselves if they thought they are valuing the business. They are not because the multiples are a pricing mechanism. They might come in handy to them, but these multiples if used intrinsically should yield the response similar to a DCF valuation, because after all, each multiple is reflective of the cash flows, growth rate, and the risks of the business. 

The hack
What's it then, can we not value a business at all? Where's the alternative? The first thing I have found is that dealing with perpetuity is both a pain and foolish. So I chuck the assumption of the stable growth period. Now we have only a selected future period for which estimates will have to be made. We still need cash flows and growth rates for that period. Because these cash flows aren't the entire stash of the business, we cannot use DCF to value the business. We will have to pick a pricing tool to estimate the price of the business. But central to this theme is I don't want to use my own estimate of the price. How do I know for sure that the business is worth 25 times earnings or 3 times book, for instance? 

Instead I want the market to tell me what the business is worth as per its own estimates and pricing. My life then becomes much easier. All I have to do is deal with the market in terms of buy, sell, or no action. Here's the vital piece of the model: The market gives me the clue as to whether the business is priced significantly higher, significantly lower, or reasonably priced. I will know it estimating the market implied growth rates in earnings, book value, or cash flows. Earnings are more important than revenues; but earnings can be manipulated. Cash flows are much better than earnings. Accounting rules can trick earnings, but not cash flows. Here's another point: I will never know the actual intrinsic value of the business. But thank heavens, I don't need to know it. All I need is the market's estimates during my investment period, and my own knowledge about the business. The key is to assess whether the absurdity in pricing is apparent. It is not important to know by how much because that is not possible without having an accurate value for the business. As long as the price appears to be absurd and out of sync with the business fundamentals, there's a case for either a buy or a sell decision.

I believe that wherever humans are involved we will find some sort of inefficiencies, which often take to some absurd levels. The financial markets aren't an exception; they happen all the time there, but at different points. The overall market may be reasonably priced, but a specific stock may be significantly underpriced, for instance. For a careful investor, observing this game from a distance gives opportunities for profit. All the investor has to do is to play the game by own terms, not giving in to the market's stunts. The game is more behavioral than mathematical. 

Apple reached $1 t market value yesterday. Since this is a fact, the potential investor has to find out what's in store for him in future. Apple's annual numbers are a couple of months away. But we know that it generated average free cash flows to firm of $45 b during the past (2013-2017) five years. It also had net cash of $153 b as of September 2017, not very different from what it reported for June 2018. The free cash flows peaked in 2015 to $66 b; for 2017, they were $41 b. We don't have to estimate the cash flows during each of the next say, 5 years. Let markets do that work. We know that the growth rates have been erratic in the past. However based on the current pricing, the markets are telling us that if these cash flows grow 5% annually, and if they are priced 18 times at the 5th year, we can make 10% annually over the 5-year period. The markets have brought their estimates of the 5-year cash flows to the present value using a discount rate of 10%. Now we have some clue regarding our decision as to whether to buy, sell, or ignore the market offering. This, I have understood, gives me the comfort in making decisions rather than simply input the numbers on the worksheet and bring out the present value. We will have to assess whether the growth rates are significantly higher or lower than that are sustainable for Apple as a business. It is still heavily dependent upon iPhones; none of its new products have been that encouraging. There is a fair amount of judgment involved in making the decision, but at least here we are challenging the market's estimates rather than making our own. We also have to check if 10% returns sound interesting to us. We can also juggle around with the growth rates and pricing multiple to arrive at the current market value of the business. It's not difficult to catch insanity in the market's assumptions. 

By the way, I still love doing that DCF stuff, why I valued Apple, Facebook, and Alphabet only yesterday. It is fun, and just that; I love it. I don't make any investment decisions based on DCF anymore, although if done accurately, DCF is the only model to calculate the intrinsic value of a cash-flow-throwing asset. But then the catch is we cannot do it accurately. Why lie to ourselves then?

That does not stop business managers and their investment advisors in pulling out complex worksheets and fancy presentations to compensate for the hollow math. That is how the mergers and acquisitions take place anyway. As I said when there is demand, supply will find its place. Managers look grand, and advisors make money on most acquisitions. The joke is, if you keep lying to yourself about something, you will eventually start believing it. Repetition works like magic in here too. My advice though is that don't try it. 

Saturday, July 28, 2018

icici, or you don't see, is the question

ICICI posted its latest quarter results. Expectations you can say, and the stock, prior to the announcement, jumped 2.31% to Rs.292.25 per share. What you are going to see on Monday is anyone's guess, after all, the bank has posted its quarterly loss in a very long time. But then it could have done that past quarter or even past year. If you acknowledge bad assets, you gotta throw them into the expenses box, and if you delay doing that, a day will come to force you into it. Didn't I tell ya? That's that; what about it now? There will be a number of opinions on buy or sell. Here's my take.

The results aren't that bad actually. Rs.61 b net interest income was better than the previous quarter and much better than the previous year's same quarter. Fee income of Rs.27 b was good enough. Most banks have had to take the hit on their treasury portfolio due to the interest rate mechanisms. ICICI chose to book them all in this quarter. Last quarter showed robust treasury profits of Rs.26 b; previous year's same quarter had Rs.8 b profits. This quarter's Rs.7 b from treasuries is only modest, because there was Rs.10 b gains from Prudential Life Insurance stake sale; without stake sale, the losses would be higher. The operating profits stood like this: Rs.51.84 b during June 2017 quarter, Rs.75.14 b during March 2018, and Rs.58.08 b during June 2018. But then the bank took almost Rs.60 b in provisioning charges during the quarter leading to its historic quarterly loss on a standalone basis. Is that a bravo moment?

There are enough credits due to the bank and is legacies. It has always been a pioneer in looking at the growth prospects and adopting systems, technology, and procedures to cater to it. Other banks might have wanted to do the same, but well after ICICI embarked on it. As for now though, the bank is facing some tough times. 

For a bank, there are a few important metrics based on which we should deal with them. Return on assets measures how efficiently the bank is run considering its invested capital. Return on equity is how much its shareholders are going to get based on their investment. Both are important, but more important is how large is the debt compared to its equity capital. A disproportionate debt size can lead the bank into bankruptcy even after a small portion of its assets go bad. In this respect, ICICI bank is well positioned. With Tier 1 capital of over 15%, the bank is strong enough to look at credit growth. Its cost of funds and cost to income are acceptable. With average CASA of 46.10%, its costs of funds should remain stable. There is a drop in its net interest margin to 3.19%, and it must hope not to take it down any further. 

Even after heavy provisioning the quarter, the bank has about Rs.258 b in non-performing assets, which is over 4.50% in net NPAs. These are of course the result of making some bad decisions in the past; lending is a serious business. The bank also has some Rs.14 b in restructured assets. If we clean up its balance sheet, and thereby its equity, we get a book value of Rs.129.83. The stock isn't cheap. 

For an investor to make money on this stock, the bank has to show credit growth with a low ratio of bad assets. A 15% growth rate, and a year's time, I don't see much happening with this stock. A two-year wait, and you might get better than risk-free rates. Over three years there is a good chance that the bank will turnaround and the investor will get a fair deal.

But as we know, who has the patience to wait, isn't that a bad virtue?

Saturday, April 28, 2018

ferrari at $23 b

Revenues for the year 2017 stood at Euro 3.4 b increasing 10% annually over the last four years. Over the same period, operating profits increased by 20% to Euro 775 m. Earnings increased by 22% to Euro 535 m; so did earnings per share. Operating margins were 22.68% (2017) compared to 15.59% (2013). Very high return on equity. Average free cash flows to firm were Euro 300 m. Not a bad performance for an auto business having sold only 8,398 cars in 2017. 


Sports V8 were in maximum demand. 


Ferrari sells a fair bit of engines too.


Now, how much should this firm be valued? It is currently priced by the market at $121.99 per share. That is $23 b or say, Euro 20 b in market value for the equity. Compare that to free cash flows to firm, and then consider Euro 1.8 b of debt; and there is cash of Euro 648 m. 

The market price appears a bit pricey. If that was the case, the equity was available for half the current price sometime in 2017 itself (its low price). In 2016, the stock sold at $32 per share when it was low. For someone who bought at that price, the increase in market value was nearly 4 times within a year. There is money to be made in every stock if you are good at market timing. Alas, isn't that difficult? Who knew it would be as low as $32 and as high as $122? Someone said it once, it is very hard to predict, especially the future.

Ferrari is a great franchise. But then every good business isn't a good buy; and at times, even a bad business can be a screaming buy. The game is between value and price; always.

The board is considering a share buyback program.


The number of shares outstanding (189 m) has not changed since 2013; and in February 2018, the Euro 100 m buyback initiative was announced by the company. In 2018, Ferrari bought 190,600 shares at $119.82 per share.


The management obviously considers that price is a bargain compared to its intrinsic worth.

To justify a buyback, two things have to fall in place: Excess cash, and price paid much lower than its value. Only time will tell whether $120 is a bargain. In the mean time, driving new Ferrari down the street is definitely red, faster than wind, passionate as sin.

Sunday, July 31, 2016

valuing berkshire

Berkshire Hathaway is priced by the market at $356 b; and it is now the seventh largest company by market-cap in the US. Amazon and Facebook just went ahead of Berkshire recently. It took Facebook about 12 years and for Berkshire more than 50 years to reach where they are today is another matter. Facebook which went public only 4 years ago is priced at high multiples of its earnings. So growth it is that the market is considering when pricing; low growth for Berkshire and high growth for Facebook.

Berkshire is a conglomerate which acts as a holding company of several diversified businesses. Each business is run by an independent CEO without much interference from the head office. It has an extraordinary business model where there aren't much of corporate meetings, forecasts or guidances. There is no smoothing of earnings either. What is earned in a quarter is what is actually reported. It is always a pleasure to read its annual letter to the shareholders. There is no question that Buffett and Munger have turned Berkshire into what it is today with the most contrarian approach possible to business and investing. 

Everyone is interested how Berkshire would perform post these two exceptional managers. More precisely, how it would reward its shareholders based on its current pricing? The class A share is trading at $216,000. Its class B shares are worth 1/1500 of class A in terms of cash flows, and are also traded in the market. Berkshire had 1.643 m shares of class A equivalent as of December 2015.

Valuing Berkshire is not easy. One has to value each business separately and add up to arrive at the value of the total business. Analysts do not want to get into that hassle. The easy way for them is to price the stock and call it value.

As much as Buffett likes to see Berkshire's stock price trade close to its book value, it is not the right value for the business. This is because Berkshire's operating businesses cannot be marked to market. It now has many capital-intensive businesses which probably should be valued much higher than book value. Therefore, book value of $155,501 per share for the company is actually not meaningful. 

At the very top level, Berkshire is an insurance company; and one of the best runs at that. Premiums received by insurance business are invested in its operating business for acquisitions. The operating business comprises several independent businesses. Premiums and excess cash from operating businesses are also invested in stock markets. Berkshire had an investment portfolio of $159,794 per share as of December 2015. Berkshire also makes underwriting profits consistently. 

Analysts price its stock by applying a multiple to its earnings. As per its 2015 annual report, pretax earnings per share from its operations was $12,304. If we apply a PE of 10, the price of operating business will be $123,040. Including investments, which are market to market, the price of the whole company comes to $282,834 per share (class A equivalent). It seems like there is an upside to its market price.

Since earnings accrue to the shareholders after tax, why should we use pretax earnings? Applying a tax rate of 35%, the after-tax operating earnings will be $7,998 per share. With the PE of 10, the operating business will be worth $79,980, and Berkshire will be priced at $239,774 per share. Still higher than its market price.

In 2015, Berkshire class A shares traded at a high price of $227,500 and a low price of $190,007. Let's consider only the high price and remove investments of $159,794 to arrive at the market price of its operating business of $67,706. This price has an implied PE of 8.47. I have not considered the low price because often the market has failed to recognize the value of its operating business altogether, which is illogical. This implied PE has been falling consistently over the last 10 years; it was 37.47 in 2000 and 4.29 in 2012. If we use the 5-year average implied PE of 8.22, the price of operating business will be $65,709 per share and including investments, Berkshire will be priced at $225,503. Again higher than its current market price, but not much.

How about its cash flows? Going forward if Berkshire is not going to be in acquisition spree, we can assume that its reinvestment requirements will be met by depreciation and other non-cash charges. If this assumption holds good, Berkshire's free cash flows will be equal to its earnings. If so, its free cash flows are going to be $7,998 per share in perpetuity without any growth and more if we assume some growth.

At an expected return of 8% and zero growth, the value of operating business will be $99,970 per share and including investments, Berkshire will be valued at $259,764. If we assume a growth rate of 2% in perpetuity, the value of Berkshire will be $295,753.

If we assume that Berkshire's reinvestment requirement will be a function of its return on equity and growth rate, the value of operating business will be $103,969 and Berkshire value will be $263,763 per share. I have assumed that Berkshire will be able to sustain return on equity of 8.50% and growth rate of 2% forever.

So we have a range of prices and values for Berkshire. Interesting part though is that all are above its current market price of $216,000. Both Buffett and Munger are probably right in their opinion about the future of Berkshire.

I would be surprised if Berkshire fails to achieve a moderate growth in the absence of its star managers. If it will not be a market-beating stock, it will also not be a market-beaten stock. 

Tuesday, July 19, 2016

a or b, which is more valuable

Recently there was a news story. But before we get to that let's do a small exercise. We have some numbers from two firms in their respective, although unrelated, fields. 


Which firm do you think is more valuable? May be we don't have complete information about their business, prospects and so forth. Yet, B should strike as more valuable, especially when we consider that B is in a stable, not declining, business. 

As of now, the market value of equity of A is $347 b and that of B is $360 b. How did that happen?

Earnings are not better indicators of business value compared to cash flows. So let's check out the cash flows. 

In the last three years, average cash flows to equity of A was $3.74 b while that of B was $20.28 b. Note that although these numbers have been taken from Yahoo Finance (for investment purposes I prefer to pick them from financial statements directly), they may not be far off. So let's move with them.

Has the market gone crazy? More often markets remain rational, but not always. Should we consider that this is one of those times? 

May be A is into some sunshine business on the verge of disrupting the industry. May be A has much higher growth rate than B. May be. However, my aim is to find out under what circumstances should higher value for A be justified.

Let's assume that our expected return from equity is 10%, and also assume that cash flows are perpetual. 

To get to their current market value, cash flows of A will have to grow at 8.92% annually, and those of B will have to grow at 4.36% in perpetuity. 

If we lower the expected return to 8%, the growth rates for A will be 6.92% and for B 2.36%. 


Even when we consider that it is a global market, not restricted to the US, growth rates of A appear to be stretched compared to B.

May be there is some time for A to reach stable period of growth. Let's assume that cash flows to firm go to equity holders in the absence of debt. What the heck is there to assume anyway?


I know that equating firm cash flows to equity is a bad idea. Let's correct it. If we assume two growth periods for A, free cash flows to equity to come to $7 b. This is how we get it: present value of average cash flows to equity of $3.74 b growing at 15% in the next 10 years at 8% cost of equity is $7 b, which is close to $7.3 b. A had revenues of $107 b in 2015; if they grow at 15% in the next 10 years, they would be $433 b in year 10. Walmart had revenues of $482 b in 2015. A would also require adequate reinvestment to achieve the required growth rate.

Even when we consider free cash flows to equity of $7.33 b, A will have to grow them at 5.89% annually forever. Can A pull it off? Time will tell. For the moment though A has a story to tell for those who want to hear.

Is growth rate higher than 15% in the next 10 years sustainable for A? Its revenues grew annually at 29% in the last 5 years. What the heck, if we assume 25% growth rate in the next 10 years? This is how it would look:

Finally, we did it. If A grows at 25% in the next 10 years, and then at 3.34% in perpetuity, it could be valued at $347 b. For that A will have to achieve revenues of $996 b and free cash flows of 35 b in year 10. Is that possible? Time will tell. All I know is that growth does not come free; it needs reinvestment to sustain it, which we have not considered explicitly.

Market value of A's equity has been growing since long. 


I have written about it earlier and before. You know what, I like numbers more than stories, earnings more than numbers and cash more than earnings. So I still ask Amazon, where's the cash? Or should I put that question across to the market?

Monday, October 26, 2015

value or growth

There is never a single approach to make money; this is granted. Each should embrace one that suits the temperament. Yet, there is only one way we can make money: buy low and sell high. Of course, we can sell first and buy later; however, the essence is the same. 

In investing, two types of approaches are well talked about. One is value investing, and the other is growth investing. Each camp is eager to take on the other. And boy, aren't those value investors too proud of their pedigree? 

I am going to keep a detailed post for some other time. At the moment, let's just highlight what the world thinks of these two approaches. Value investing is construed to be picking securities at low prices such as low price-earnings, low price-book values, high dividend yields. The key for value investors is bargain prices; they like to call it statistical bargains. Whereas growth investing is taken to be investing in stocks that have higher than normal growth rates. The key for growth investors is the growth rate, not price. 

I am not in either camp. It is better to be an investor than a value or growth investor. If investing is all about buying securities that are priced lower than value, that's all we need to think about. 

If what is given away is higher than what is received, it is not a business-like transaction. There are other places where such actions are applauded. That person will be well served if charity work is taken up; even here one can feel what is given away is lower than what is received; the pleasure of giving is beyond any pricing. 

In business and investing, profits are made by buying low and selling high. The focus therefore should be on the present value of cash flows and price paid. Four things are of importance here: There should be mispricing, which should be identified and then taken advantage of, and finally, the markets should correct that mispricing. 

In investing, the predominant factor is the mispricing of securities, not the type of securities or the period of holding. For an exceptional business, the longer the holding period, the higher the returns. For a low quality business, it is preferable to close out the transaction as soon as mispricing is eliminated by the market. When low risk arbitrage opportunities are available, the transaction period can be much shorter. 

All investing is value investing, for what is investing without value? Similarly, it isn't investing, if price paid for growth is higher than value of growth. It is a mistake to separate the two. And we know that if it is not an investment, it is actually a speculation. Heck!

Tuesday, September 29, 2015

amazon, price and value

In February 2014, I asked how long is long term for Amazon. At that time we could buy its entire equity for $160 b if we had that kind of money, and analysts had estimated that in a year's time the market cap of Amazon's equity would be $200 b. And lo and behold, it is $235 b now.  


Analysts sometimes are better at estimating short term, rather than long term. If they were good at long term consistently, they would stop talking and become rich; and that's another matter for another day.

How can Amazon back up its story? During 2014, it clocked revenues of $88.9 b, an increase of over 19% compared to 2013 revenues. In fact, revenues have increased at much higher rate during the last five years. Check this out: Amazon had revenues of $19 b in 2008. If Jeff Bezos had a vision of scaling its revenues, well, we know where he stands. 

What about its operating margins? Although, I do not go by the external service provider's reporting, I know that it is very low and has been coming down over the years.


One adjustment we can make to its reported numbers is its non-cancellable lease commitments. Nevertheless, the operating margins of Amazon are minuscule. It does generate some free cash flows to firm; yet, they aren't adequate.

Amazon started as a book retailer, and moved on to become an online general retailer, and now is also involved in cloud computing and drones. So we know, it has the ingredients to scale up its revenues much higher. 

With all this, will it succeed in bringing its operating margins to a respectable number? Because without this it will not be possible for Amazon to increase its intrinsic value. Or are we missing the big picture? Can we also make a case for adjustment of its advertising costs and research and development costs and argue, if we believe in the argument, that they are more of an enduring nature?

Low operating margins have not stopped analysts from being bullish on its story. No one is recommending a sell.


Now, the mean estimate for Amazon's equity is $300 b in a year's time. I did a valuation of Amazon in February 2014, and my story about Amazon has not changed since then. 

I do wish Amazon and Bezos a happy long term story. Bezos is an amazing guy.

Thursday, June 18, 2015

there is no precision to valuation

I have written about valuation earlier. It is no secret that value of an asset is the present value of its future cash flows discounted at an appropriate rate. In other words, it is today's value of cash that can be taken out. 

If there are no cash flows, there can be no value, period. There goes the so-called-valuation of precious items such as gold, silver, or even collection items, for a toss. You cannot value them, you can only price them. 

Let's move to cash flow generating assets, in particular, stock of a business. The business will have cash flows until it is liquidated. A good business might have positive cash flows, and a bad one might have a stretch of negative cash flows. Yet, cash flows are what matter when we want to value the business.

Heck, both cash flows and discount rate to be used are difficult to estimate. For this reason, most of the analysts and investors use multiples to come up with pricing, and call it valuation. The expectations game and the timing game are routinely played in the market. 

When we have constraints on estimating cash flows and discount rate, it makes sense to look for alternative approaches to investing. I noted how private equity investors expect return on their investment. 

The more we think about valuation, the more we should accept the fact that no valuation is going to be perfect: The cash flows are going to be wrong; the discount rate is going to be wrong; and even more, the entire process is going to be colored by emotions; our greed, fear and envy at the point of valuation impact our estimates. It is hardly surprising that our valuation is not going to be right. 

So what do we do? We still need an approach to make money off the markets, and if we believe that often markets are inefficient, there is all the more reason to think about ways to deal with that. Of course, for an investor with no time and interest, buying index is the best approach, that boring, low risk investing.

For the investor who has both time and interest in equity analysis, it is exciting, yet, the constraints remain the same: estimating cash flows and discount rate. Assuming that he can play the waiting game to deal with estimating cash flows, he still has to find a way to come up with the discount rate.

Here, the private equity approach comes handy. The academia and most of the analysts restricted by the institutional imperative use the CAPM to calculate the discount rate. The value investing camp rubbishes it, but fails to lay down an approach that can be used consistently. They like to take a dig at the rest of the world, but often, do something similar implicitly. For instance, they also use different discount rates for different cash flows streams, just like the CAPM guys; the CAPM guys are more explicit in their calculation of the discount rate, while the other camp is more implicit. There are other silly things that value investors do, which I will deal with another day.

I have no right answer to deal with the discount rate. Nevertheless, it is important to note that value of a business changes when we change the discount rate, sometimes significantly. Therefore, it is wise to be realistic when an investor uses the discount rate.

If the discount rate represents our opportunity cost for postponing present consumption, retaining (or increasing) purchasing power, or even dealing with the uncertainty in the future, we need an appropriate return on our investment. Going back to basics, an investor should expect a rate higher than the government treasury, a rate higher than high quality debt instrument, and also a rate higher than the market rate.

If this is acceptable, we can come up with a way to accept the discount rate too. Here's how.

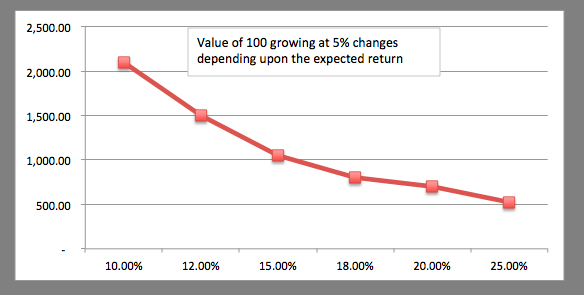
The value of a business with cash flows of 100 growing at 5% perpetually changes as we change our expected return. If its stock is trading at 1,500, at 10% expected return value is higher than price. The question to ask, however, is whether 10% return is acceptable. We could buy government treasury or a high quality bond for that return. If we buy at the current price, the expected return is 12%, is that adequate considering our opportunity costs? If the expected return is 15%, the price has to come down by 30% to 1,050; but wait, can't we get that return by just buying the index? I reckon, for a selective stock picking investor, the expected return cannot be lower than market returns. Therefore, he will have to ask for more than that. Let's start with 18%; for this return, the market price has to come down by 46% to 807.


In fact, this simple model can be extended to the standard DCF model, using cash flows and growth rate that are demonstrable for the business until it becomes mature, and after that using return on capital, growth rate, reinvestment, and cash flows that characterize the stable business.

Logically then, the investor would wait for the price to come to 807 or lower to provide adequate return to his investment. For any lower returns, he has alternative investments available. So that means the investor will have to happily come back to my favorite, the waiting game.

The concluding thoughts: The investor cannot come up with an accurate value of the business given the constraints on the precise discount rate. Rather than attempting to value, he should wait for the prices to reach to his level of expectations. The investor should not calculate the discount rate using the CAPM like the academia and institutional analysts, and he should rather not use an arbitrary discount rate like the value investing camp.

What he should do is wait for the price to fall - and there will be occasions considering efficiencies in the market - before he can buy any stock so that he will get adequate return on his investment.

What is the point in swinging routinely, just for the heck of it? Don't we have better things to do in life?