Pages

Saturday, August 17, 2013

nifty - future to the back

The market is making merry.....at the cost of punters, of course. 


We are down from where we stared the year; and it's already 7 months. That means we have only 5 months to recoup. Can we? Of course. Would we? I don't know.

For those who invested for the short-term without understanding how firms operate, businesses function and markets react, it has become tough, I guess. Market inefficiencies galore.

We have seen before: 1) the drunken steps; 2) the 1000-6000 market; 3) what moves the market; 4) falling prey to the numbers.  Humans are not rational animals, but rationalizing ones. 

The only way we can make money in the stock market is by understanding businesses and their value, and buying them at the right price. Good behavior (control of emotions, in particular) is critical in this process, not extraordinary brilliance.

Financial history is full of highly intelligent people who stumbled along the road.

Wednesday, August 14, 2013

fighting for the penney

It is not very clear (or may be it is) what has gone wrong with JC Penney; for its market value has dropped southwards with some speed.


From $9 b in Sept-2008 and again in Feb-2012, now it is worth $2.8 b. You can keep waiting, but it might look longer.

Of course, a few things went wrong: Lower revenues and operating losses, poor management of cash, and the fighting management. Instead of looking at ways to improve the business performance, the fight is on with pointed fingers. 

JCP's capital has reduced from $10 b in 2003 to $6.5 b in May-2013; its cash has reduced from $3 b to $0.8 b. The business earned about $3.6 b during the period, paid dividends of about $1.4 b and bought back its stock for about $5.5 b. Now, its debt stands at $3.7 b.

One of the rudest ironies - call it error of judgement - its stock buybacks were made at the wrong time. Of course, it is visible for us with the advantage of hindsight.


The firm bought its shares back worth about $1.6 b in 2004 and $2 b in 2005; it couldn't be below $35 per share (see above), probably more. It bought back again in 2006 and 2007. It also bought back about $0.9 b in 2011, again probably for about $35 per share. In all, approximately $5.5 b was spent on buybacks, which unfortunately, did not work. 

Stock buybacks are good when the stock is purchased at less than the intrinsic value of the equity; these should be done only with excess cash. Otherwise, the cash spent would cost the shareholders heavy, which it did apparently. See the stock price now at $13 per share.

The times aren't good it seems. Is the turnaround possible with a different CEO now? Time will tell.

Friday, August 9, 2013

airline business - trying hard to make money

If this chronicle has to be believed, Kingfisher Airlines is now worth anywhere between Rs.7,000 crores to more than Rs.8,000 crores. The irony is that almost all of it is due to the debt-holders, rather than the equity-holders. 

The airline's equity is now selling at Rs.320 crores, but likely has debt over Rs.7,500 crores. The actual amount of debt is not published, yet. 

Make the mistake of buying the entire firm, quickly you assume that mountainous debt.

The market value of equity has had a nasty ride: Those 7 years:


Look who appears to be a winner - it's the Nifty, which otherwise is not.

And those 8 years for Jet Airways: Market value - Rs.2,800 crores. Debt - over Rs.9,000 crores


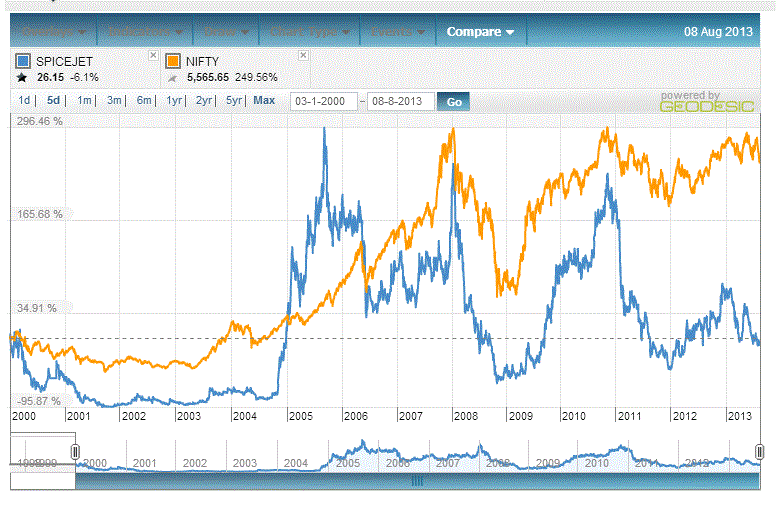
And those 13 years for Spice Jet: Market value - Rs.1,350 crores. Debt - likely over Rs.900 crores


Where is all the money? Neither here; nor here.

What a business an airline venture has been! Large capital, losses; more capital, more losses - a global airline phenomenon.

Kingfisher has to come up with a revival plan now; but how?

Wednesday, August 7, 2013

the drunken steps

Just when we were talking about the 6000-market a few days back, we probably did not know that it was on steroids. 

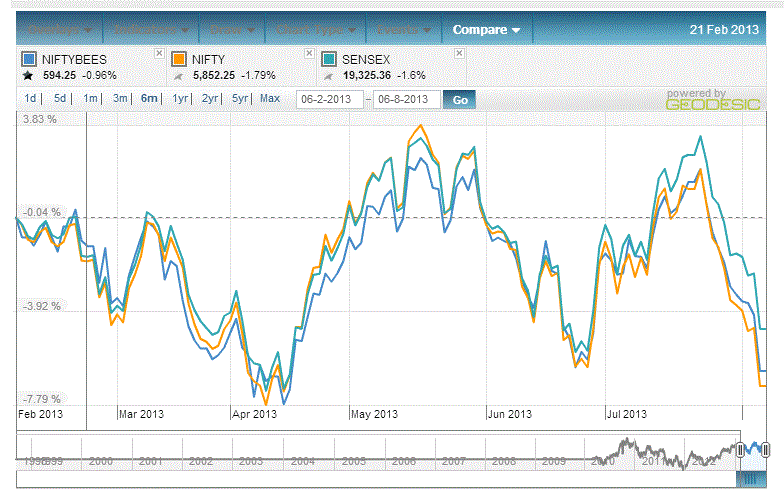
It was due for some contraction, I guess; and it did:


These were the steps:


I am not sure what changed over these months in terms of the fundamentals. I don't know why it had to go to 6000 from 5500 and come back there. Some activity for the idle I reckon.

The game is played by the institutional investors, especially the foreign. They set the prices. They drink and inhale...it is they who are on steroids. Their pendulum swings between the points of manic optimism and manic pessimism. Have they ever been rational? Their performance speaks for itself probably, for a majority of them fail desperately trying to beat the market.  

You can pick a starting point and see how much the market has fallen or risen. Now, it is on an earnings yield of about 6%, probably the highest for sometime; 2.75 times the book and has a dividend yield of 1.5%.

It was not me who said long back, a strange enigma is man...... Whoop!

valuing facebook

Facebook is back in action....the price has moved from near-40 to below-18 to 38 within months:


At the current price of $38.40, Facebook is worth around $92 billion. But is it really worth that much? To attempt that question, let's have a look at its historical performance:


Facebook earned $32 m on revenue of $5 b in 2012. If we consider 2012 as a one-off year, extrapolating its Q1 2013 we get earnings of about $1.3 b on revenues of about $7 b. It had operating capital of about $4.6 b in 2012 and about $1.8 b in 2011.  

There you have a firm earning a pretty decent rate on capital and trading at about 70 times its (extrapolated, future) earnings. Assuming Facebook as a high-growth business, is such a high value for growth justified? We can't tell anything about it since it is extremely difficult to value growth, especially for a technology business.

But we can look for some clues.....to begin, we can find out the number of companies that are worth close to $100 b and having earnings of around $1 b. This list has the world's biggest public companies compiled in May 2013. I have selected some numbers that look interesting:


We know that historical profits don't really matter for the market for valuing businesses. Suddenly, it gets some insight on the firms' future profits for its model. 

Facebook has about 2.4 b shares outstanding and some stock options too. While stock options are likely to grow in future, for simplicity we can do some math (no dilution in stock) to see how Facebook stands for its current valuation. 

We can test this in another way: It is unlikely to pay any dividends in the next 10 years. If we believe that its latest earnings are sustainable and will grow in future, we can find out at what rate these earnings will have to grow in the 10-year period assuming Facebook would trade at about 25 times its earnings at that time, in order to earn a decent rate of return for the investor. Here's how it looks:


If an investor buys Facebook at the current valuation, (say, $92 b), its earnings will have to grow at about 27% compounded over 10-year period for the investor to earn about 15%. Is this possible for Facebook to pull of? I am not able to answer this. But you have to decide whether you want to take a chance just for earning 15%. Because the odds are: if earnings grow at 15%, the return for the investor would come down to 4%.

Next I want to look at the price at which one could be comfortable in buying.


If our assumptions (earnings and their growth, PE, no dilution and no dividends) stay, the investor has to buy Facebook at $69 b (about 25% lower than the current price) in order to earn 18% return on the investment. If he buys at 75% lower, the return would be about 32%!

Is this possible? The biggest challenge is the earnings growth. This is a call I cannot take. But some seem to be experts on these things. For them it is a piece of cake to get hold of the latest earnings, apply a growth rate to it and rationalize the price.

Watch the fun:


If earnings growth drops to 20%, our return would drop to 11.6% from 18% when bought at 25% discount to the current price. 

Some more fun when earnings growth is at 15%:


Of course, you could say that Facebook's earnings would grow at 27% over the 10-year period and it would trade at 40 times its earnings at that time. Before you do that just look for the companies trading at that rate. But then, anything is possible; life can be great.

Amazon did it although its recent performance has been a little erratic. Google has done well too.

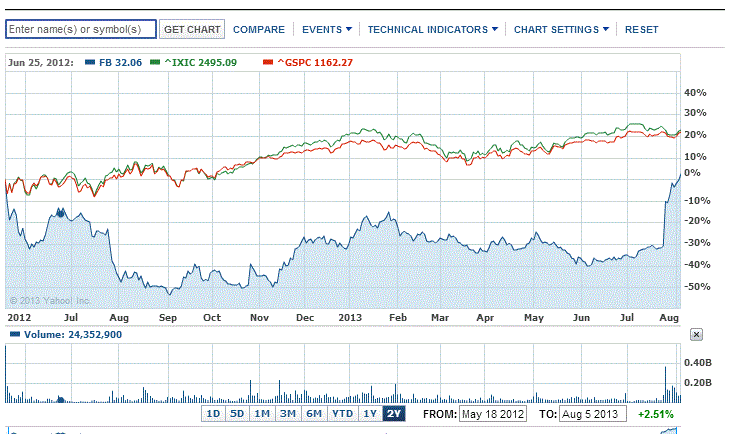
Facebook's past performance may not be a very good indicator, but this is how it did compared to the broader market:


Facebook's earnings are difficult to predict and its managers are insiders.

In the final analysis, my conclusion is that I cannot buy Facebook at its current price and I cannot find a way to reasonably value it in order to decide on a price to buy either. I don't care.

You decide for yourself. 

Saturday, July 20, 2013

the 1000-6000 market

Nifty crossed 6000.....well,......again. Its journey has been pretty interesting. 

Tryst with 1000 points
In March-1992 Nifty crossed 1000 points for the first time. Then it drifted until Dec-1993 when it got to 1000 again.

I am not sure whether it was possible to trade in 1992 as NSE was incorporated in November 1992, recognized as a stock exchange in April 1993 and the equities market went live in November 1994. But here is how the historical data for 1992 looks like as per the NSE website:


In Sept-1995, Nifty was 1000 points. In Jan-1997 it reached 1000 again. In March-1999, 1000 again. The wait was not over, for it reached 1000 points in Nov-2001; it was 1000 again in Sept-2002 and May-2003. It was like a 7-year-itch with Nifty for the investor.

Talk about investing for the long-term: Where is the return?


The journey to 6000
We know what happened after May-2003. The rally was mind-blowing: 1500 in Oct-2003; 2000 in Dec-2004; 3000 in Jan-2006; 4000 in Dec-2006; 5000 in Sept-2007; 5500 in Oct-2007 and then 6000 in Dec-2007.

More than 5 years later it is back to 6000 in July-2013. On 5 Nov 2010, Nifty reached its highest points of 6312.45. 


Past Vs future
Despite the volatility in the market, if someone had invested in Nifty in 1995 and held on to it until now, the return would have been about 10% compounded; not bad considering the long-term capital gains tax environment. However, there were numerous opportunities in the interim to enhance returns considerably.  For instance, if the investment was made in 2003 the return would have been about 19.6%. It might appear to be an achievement based on the hindsight, but the point is that one need not have had major insight on long-term economics of this emerging market. Instead, the guys waste time on short-term predictions.

The truth is, to make real money, be it investing or anywhere, you need time. Go ask any good businessman. Things falter as they did: investment return from 2007 to now is nil, a heavy opportunity cost. But then who is saying put everything in equities, especially for the passive investor? Let's talk about it in a separate post. Things get back too as they did: recollect that 19.6% return.

Can this return be replicated in the future? We are talking about the foresight now. I don't know, but consider this: this country has gone backward (well, almost..) in the last few years due to pathetic decisions by the government which has brought us higher inflation, rupee depreciation, current account deficit, depletion of foreign exchange reserves, slow growth rate, and much worse. Now there is no choice but to correct those mistakes which is likely to happen irrespective of which party forms the government next year. Back to the same story: growing population, growing needs, growing demand. If the right environment is created this market should go way ahead. There is so much to be done in infrastructure, energy, and other sectors - public-private partnerships, market-driven pricing policies and job creation.

Take your call on this market.

Sellers market 
As of now, Nifty has earning yield of 5.46%; compare this to the government bond rate of about 8%. It is trading at about 3 times book and 1.37% dividend yield. I am not sure if the broader index is in any way attractive. 

Sure there are some good stocks out there. But then they are always there. We need to just dig them out as they don't come announced. That's where investing skills (thorough analysis, not gambling) come to play: right investment behavior and approach. 

All that is required is to beat inflation by some points. Easier said than done for many. You could be a passive investor by buying the market itself; or you could be an analyst picking the right stocks. Where do you belong? Don't tell me there is a middle way. 

Saturday, July 13, 2013

a tale of two stocks

Have a look at the below graph:


Over the last five years, Infosys stock price has increased 67%, TCS 302% compared to Nifty's 48%. While it was better to put money in Infosys instead of the broader Nifty, it isn't the whole truth. 

What are the causes - management, corporate performance or market frenzy? If we analyze the performance of the business of these two firms, we will get some story to tell. 

In 2009, TCS revenue was Rs.27,813 crores and for Infosys it was Rs.21,693 crores. Earnings were Rs.5,256 crores and Rs.5,988 crores. Not poles apart. Market gave higher value to Infosys at about Rs.75,000 crores compared to Rs.53,000 crores to TCS due to the former's superior operating margins. The writing was on the wall in favor of Infosys.

Now in 2013, that writing appears to have been replaced by another script. TCS revenue was Rs.62,989 crores and Infosys, Rs.40,352 crores. Earnings were Rs.13,917 crores and Rs.9,429 crores. 

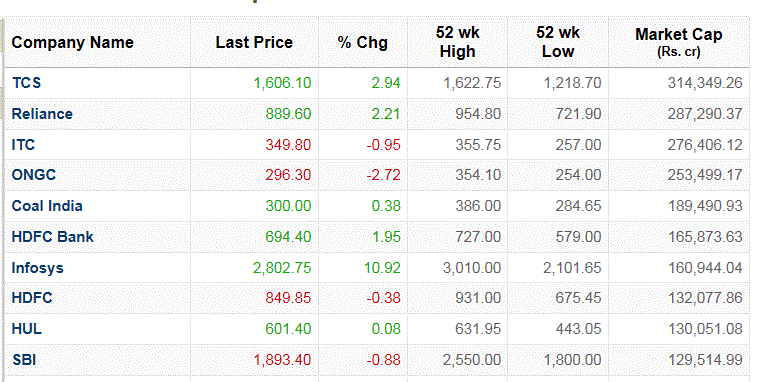
This performance has given TCS a market value of about Rs.314,000 crores compared to Rs.161,000 crores to Infosys. Is this justified?

TCS revenue and earnings grew at a rate of 22% and 27% compared to about 16% and 12% for Infosys. Margins also have been better for TCS. A superior performance. 

However, Infosys has at least one number in its favor: On a per-share basis it has beaten TCS. EPS of Infosys grew from Rs.104.53 to Rs.164.20, a growth rate of close to 12% compared to Rs.54.20 to Rs.71.82 for TCS, a growth rate of just over 7%. 

Return on equity, which is an important indicator of how capital has been employed by management, is definitely in favor of TCS: An improvement from about 43% to 47% now for TCS and deterioration from about 43% to 30% now for Infosys.

The perception of the market has changed clearly though - PE for TCS was about 10 in 2009 compared to more than 22 now (based on annual historical numbers).  For Infosys, it was just over 12 in 2009 compared to about 17 now. 

The story hasn't been that good for Infosys. Well, TCS is the most valuable company in India now; almost double the size of Infosys.

Heck, what's happening at Infosys? Too many things - one is bringing back Mr.Murthy.  His efforts surely would be to narrow the gap we see in the below table as much as possible.


Here's the final piece:


Of course these recommendations are only for the next 12 months. I leave it to you to guess the right one for TCS and Infosys as I am not that interested in the brokers' abilities.

I cannot buy into any of these stocks, for there is too much to predict over the next 5-10 years: Management behavior, Information technology environment, Developed markets growth rates, Emerging markets growth rates, foreign exchange rates, and so on.

Technology is good, but I can only applaud the leaders from a good distance. 

Let's look back some years later to check on them.